Fig. 1.

Download original image
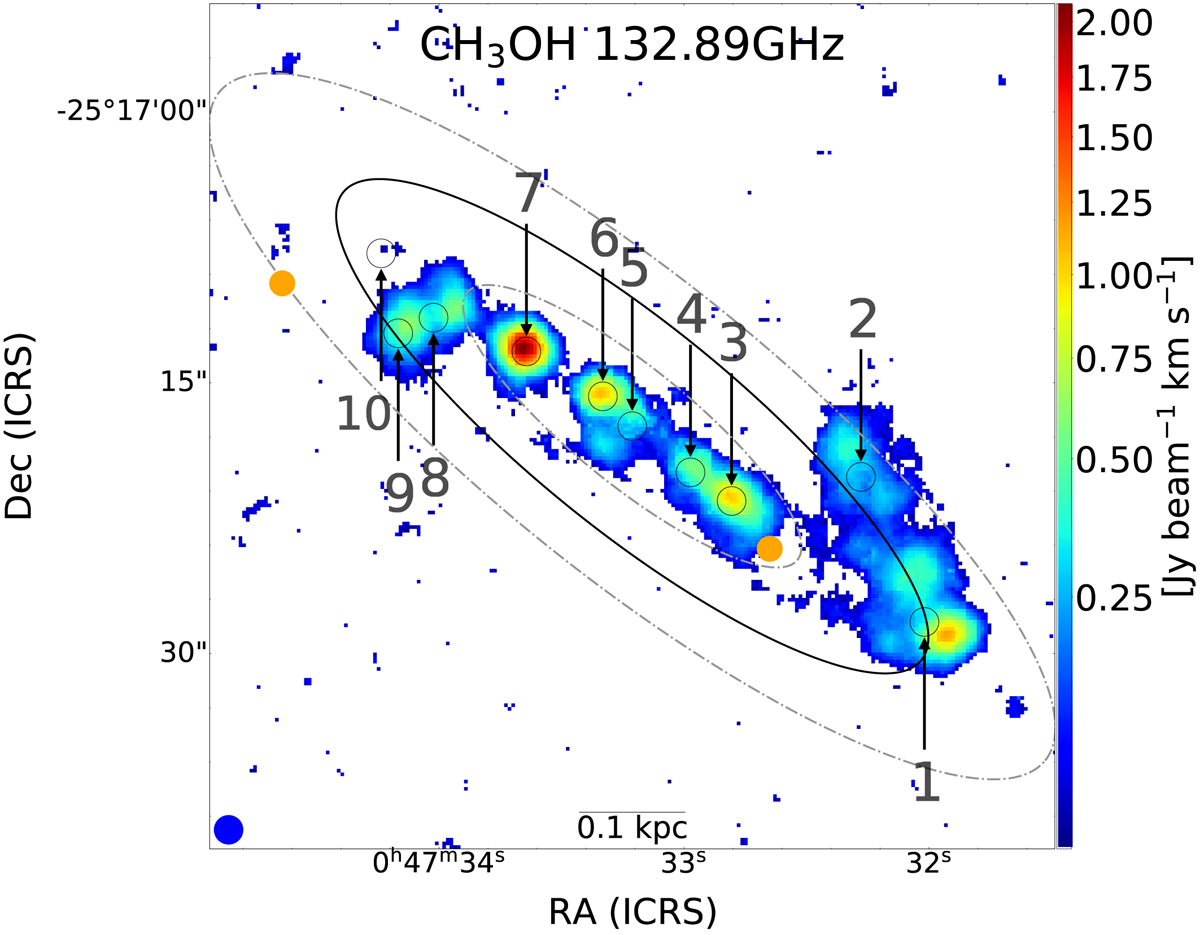
Integrated intensity map for the 6−1 → 50 − E methanol line at 132.9 GHz (within a velocity interval of vsys ≲ ±200 km s−1). Selected positions for spectral extraction (Sect. 3) are encircled in beam-sized apertures and numbered from 1 to 10. The center and edges of the inner Lindblad resonance from Iodice et al. (2014) are denoted with a black ellipse and dash-dotted gray ellipses, respectively. Superbubbles identified by Sakamoto et al. (2006) are indicated as orange circles. The ALMA beam (![]() ) is shown in blue in the bottom left corner.
) is shown in blue in the bottom left corner.
Current usage metrics show cumulative count of Article Views (full-text article views including HTML views, PDF and ePub downloads, according to the available data) and Abstracts Views on Vision4Press platform.
Data correspond to usage on the plateform after 2015. The current usage metrics is available 48-96 hours after online publication and is updated daily on week days.
Initial download of the metrics may take a while.


