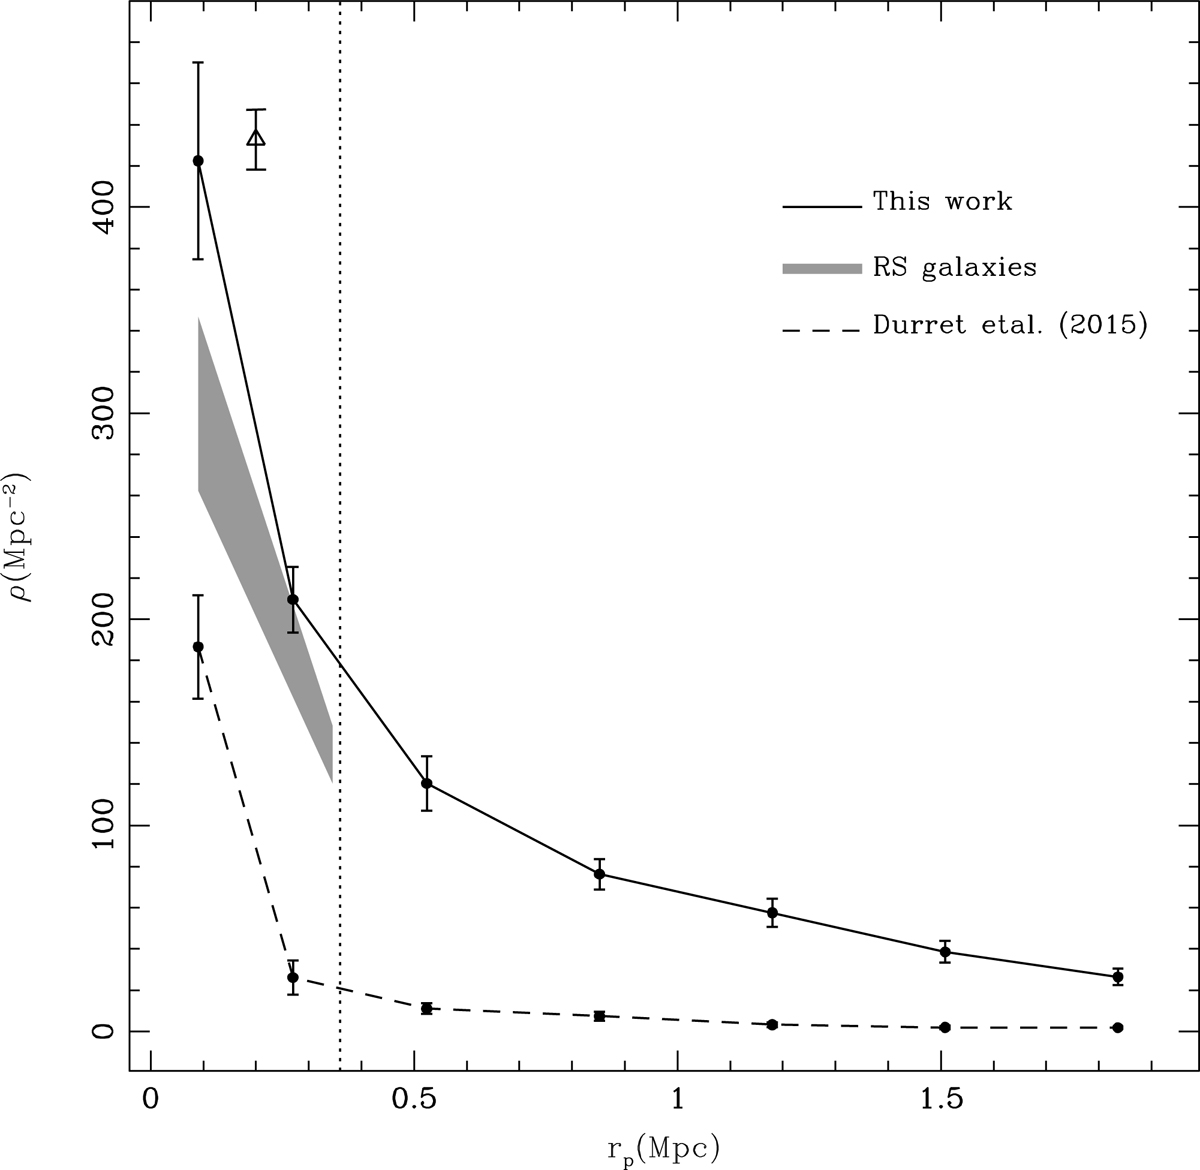
Fig. 4.
Download original image
Density profiles as a function of the projected distance to the cD galaxy for the whole galaxy sample from this work, the galaxies from the inner region (within 3σ of the RS linear fit) from this work, and the galaxy sample taken from Du15. The vertical dotted black line indicates the boundary between the defined inner and outer regions. The open triangle represents the predicted value from the mock catalog.
Current usage metrics show cumulative count of Article Views (full-text article views including HTML views, PDF and ePub downloads, according to the available data) and Abstracts Views on Vision4Press platform.
Data correspond to usage on the plateform after 2015. The current usage metrics is available 48-96 hours after online publication and is updated daily on week days.
Initial download of the metrics may take a while.