Fig. 3.
Download original image
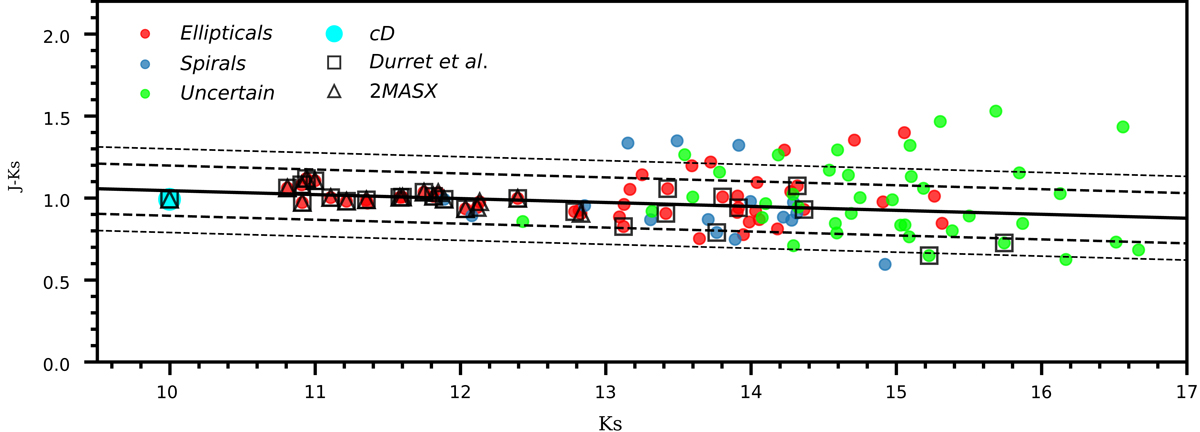
Near-infrared color–magnitude diagram of galaxies, J-Ks vs. Ks total magnitude. The RS fit, using the ten brightest galaxies, is shown by the solid black line. The dashed and dotted lines indicate ±3σ and ±5σ around the fit, respectively. The new cataloged galaxies are presented, color-coded by morphological classification. Galaxies from Du15 and 2MASX, with redshifts similar to that of the Ophiuchus cluster, are shown with open squares and open triangles, respectively.
Current usage metrics show cumulative count of Article Views (full-text article views including HTML views, PDF and ePub downloads, according to the available data) and Abstracts Views on Vision4Press platform.
Data correspond to usage on the plateform after 2015. The current usage metrics is available 48-96 hours after online publication and is updated daily on week days.
Initial download of the metrics may take a while.