Fig. 2.

Download original image
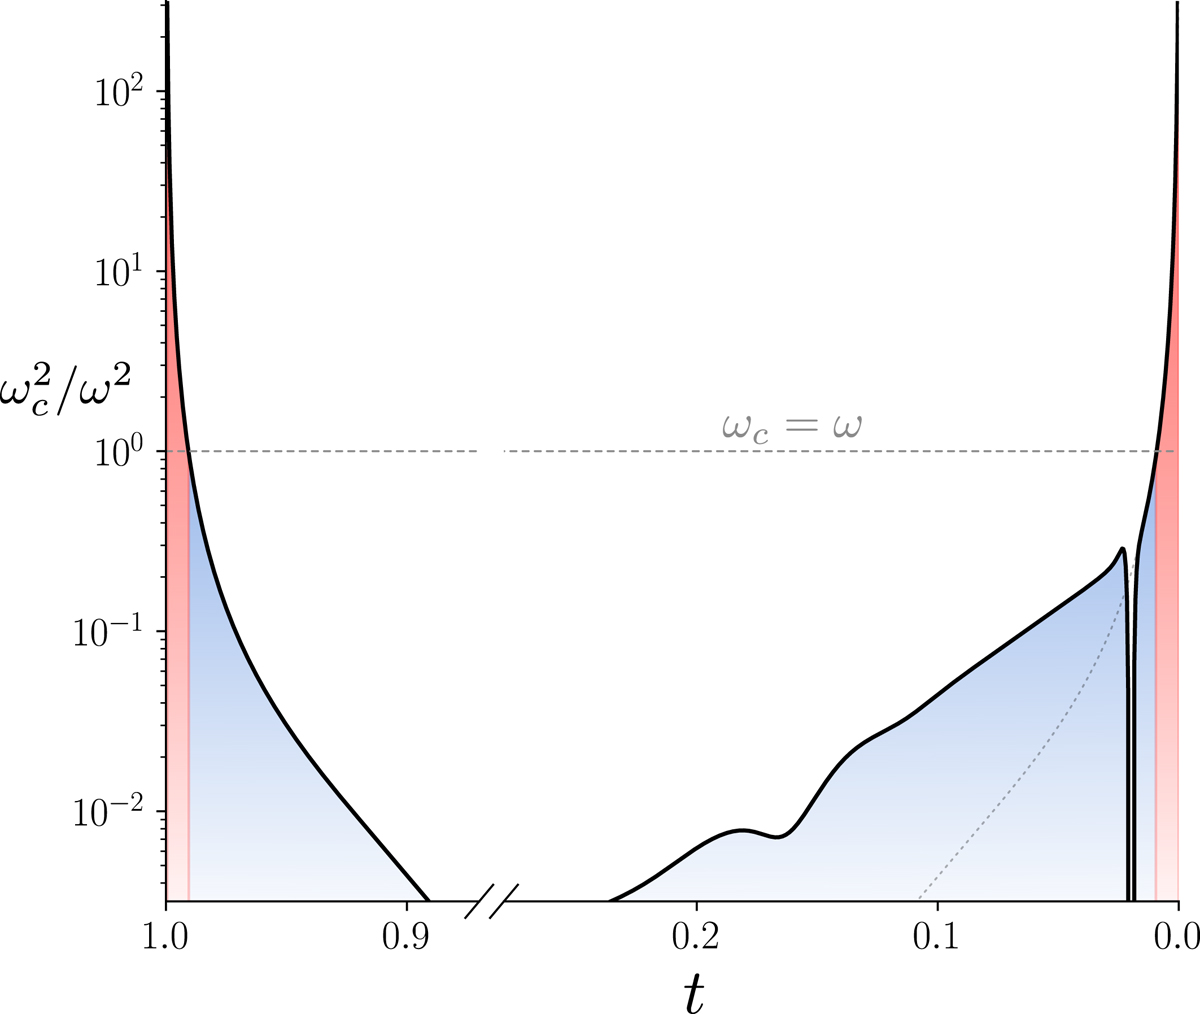
Example of the ratio ![]() in a solar-like model with respect to the normalised variable t = τ/τ0 (the surface is located on the right-hand side and the centre is made visible by a cut on the axis). In the above plot, we have chosen a typical solar pulsation frequency ω = 2π × 3000 μHz. The wave propagates in the blue shaded region (0.01 < t < 0.99) below the horizontal dashed line (ωc = ω) while being damped in the red shaded area. The dotted line near the surface has been added for the sake of comparison and represents the symmetric counterpart to the curve near the centre. It overlaps with the actual curve down to the ionisation region.
in a solar-like model with respect to the normalised variable t = τ/τ0 (the surface is located on the right-hand side and the centre is made visible by a cut on the axis). In the above plot, we have chosen a typical solar pulsation frequency ω = 2π × 3000 μHz. The wave propagates in the blue shaded region (0.01 < t < 0.99) below the horizontal dashed line (ωc = ω) while being damped in the red shaded area. The dotted line near the surface has been added for the sake of comparison and represents the symmetric counterpart to the curve near the centre. It overlaps with the actual curve down to the ionisation region.
Current usage metrics show cumulative count of Article Views (full-text article views including HTML views, PDF and ePub downloads, according to the available data) and Abstracts Views on Vision4Press platform.
Data correspond to usage on the plateform after 2015. The current usage metrics is available 48-96 hours after online publication and is updated daily on week days.
Initial download of the metrics may take a while.


