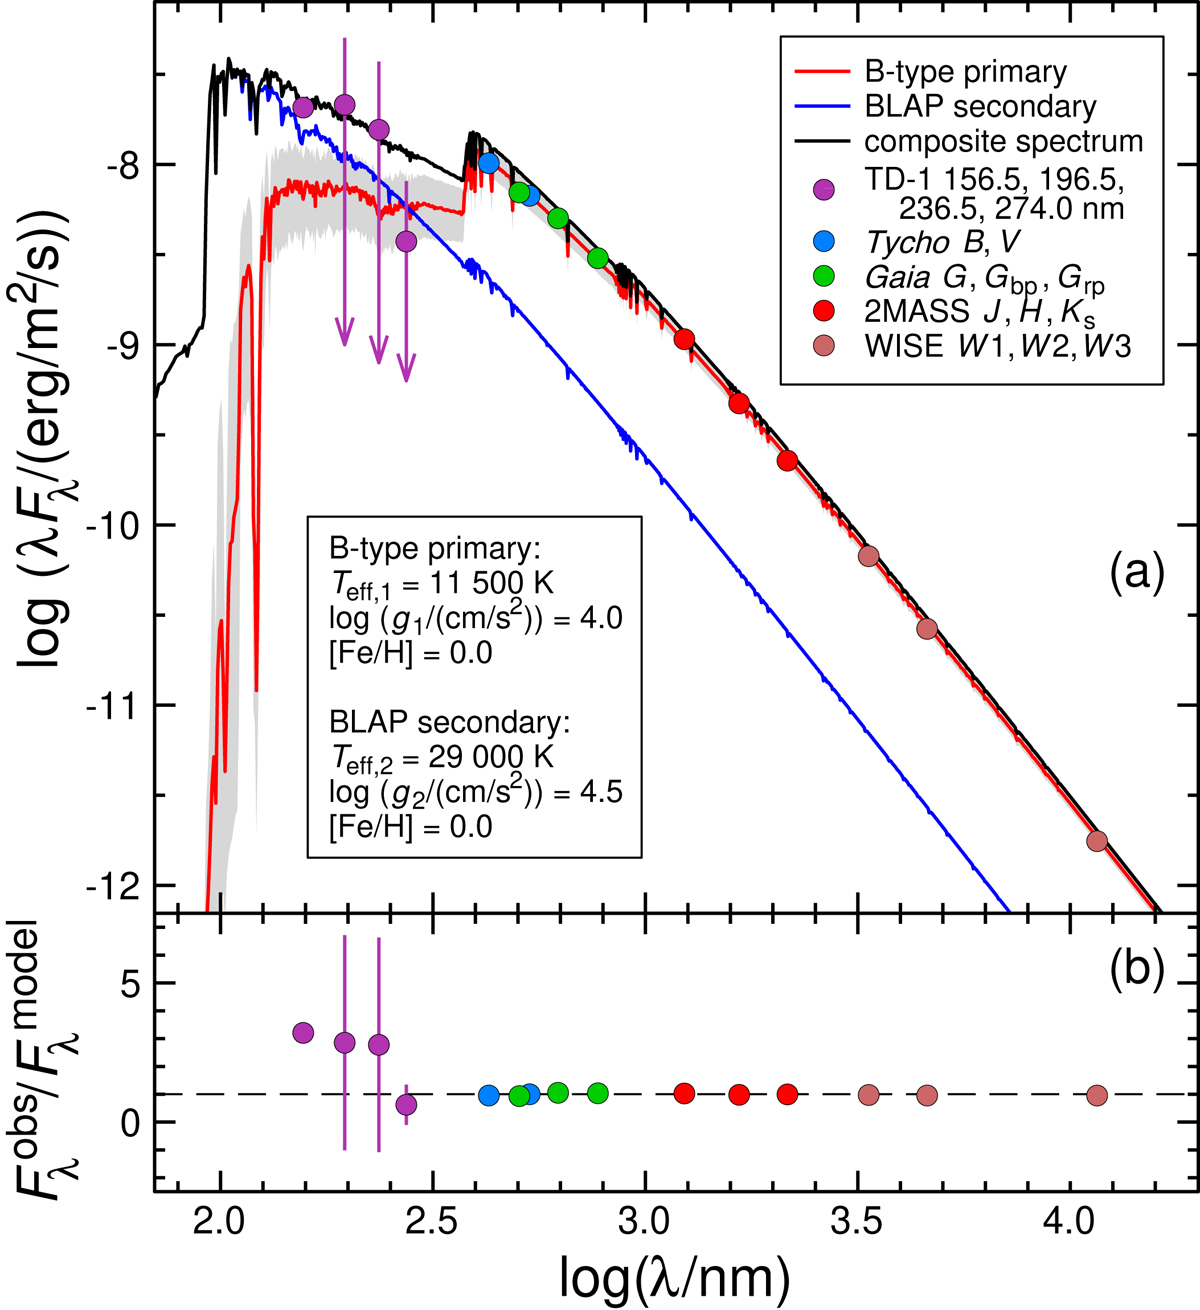
Fig. 6.
Download original image
Results of fitting SED to the photometric data of HD 133729. (a) Colour-coded points with error bars stand for observed fluxes de-reddened by the VOSA tool. The spectrum fitted to the optical and IR data is shown with solid red curve. The shaded area marks the effect of ±1000 K uncertainty in Teff, 1. The adopted spectrum of the BLAP scaled to account for the UV data is marked with blue line. (b) Residuals from fitting SED to the visual and IR photometry of HD 133729 in the terms of flux ratio.
Current usage metrics show cumulative count of Article Views (full-text article views including HTML views, PDF and ePub downloads, according to the available data) and Abstracts Views on Vision4Press platform.
Data correspond to usage on the plateform after 2015. The current usage metrics is available 48-96 hours after online publication and is updated daily on week days.
Initial download of the metrics may take a while.