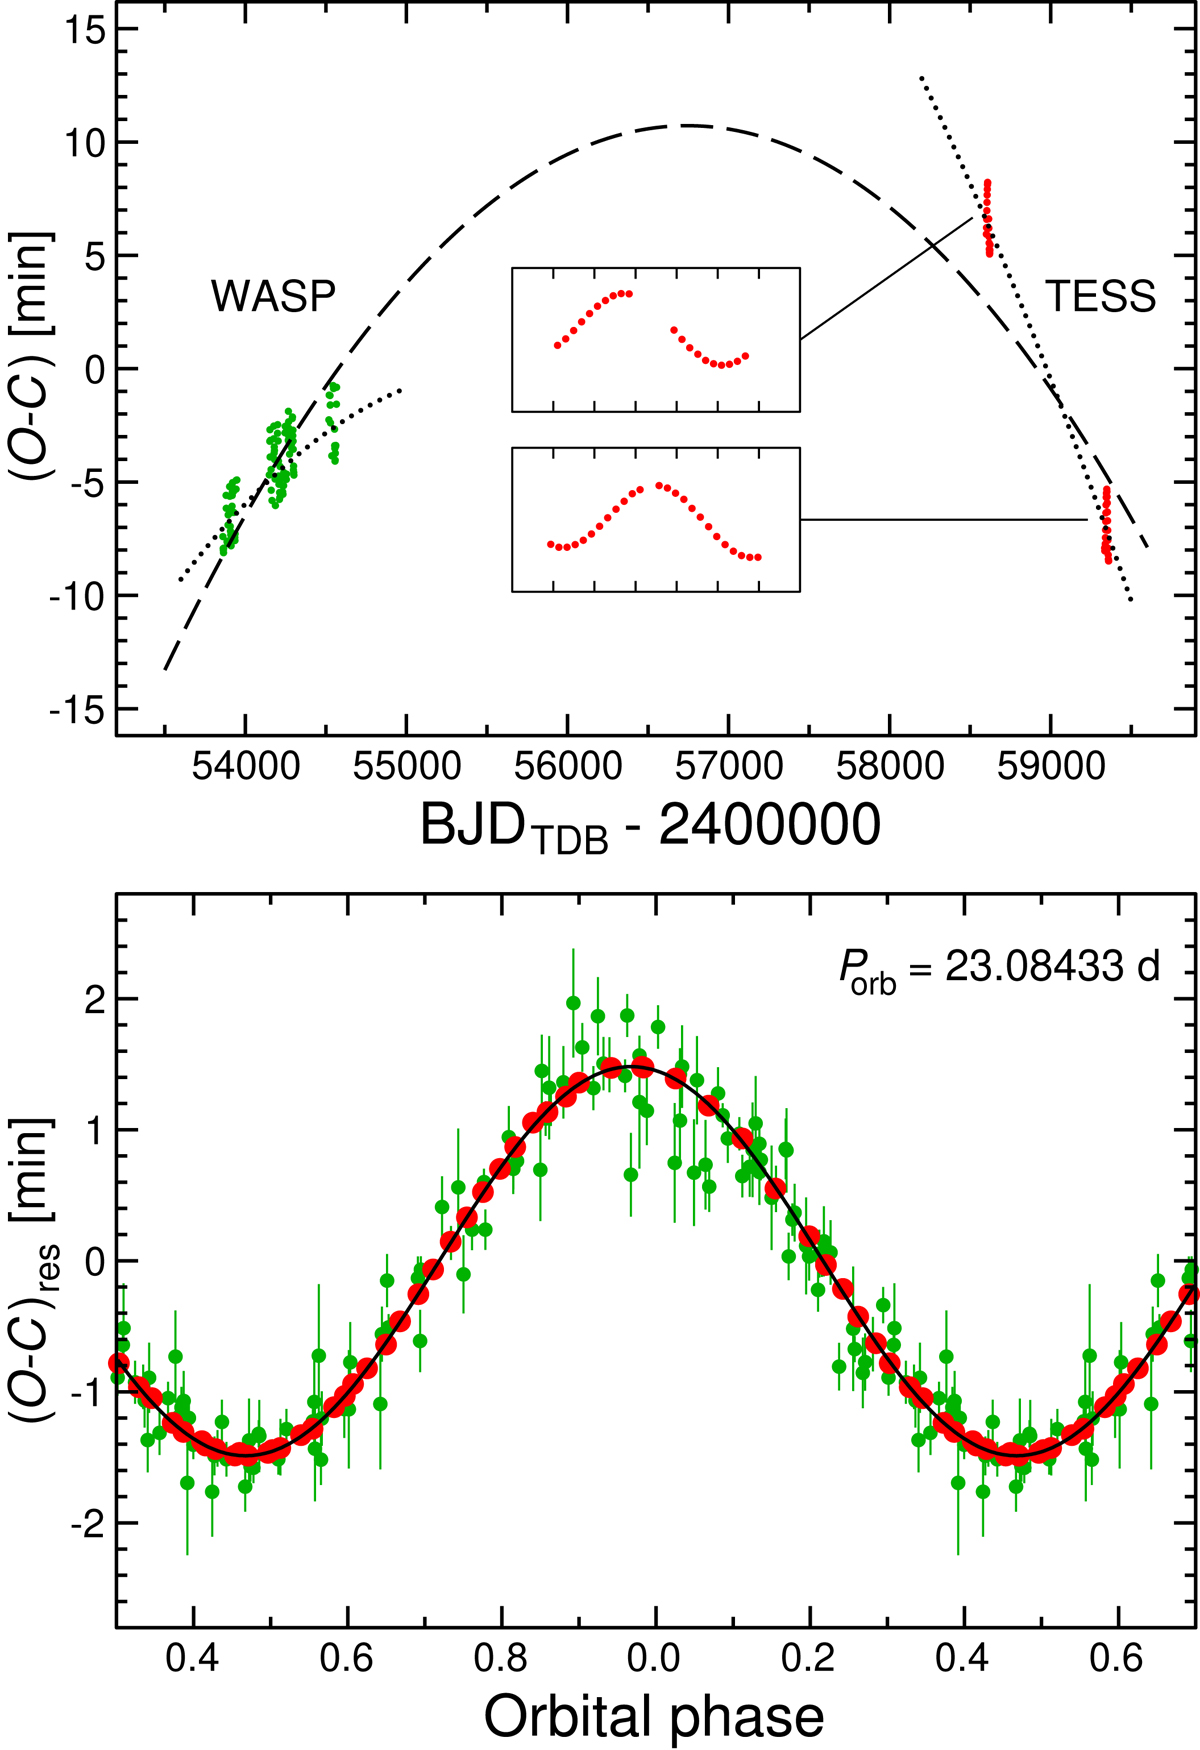
Fig. 4.
Download original image
O−C diagrams for the pulsation period of HD 133729. Top: O−C diagram for WASP (green dots) and TESS (red dots) times of maximum light obtained using Eq. (2) as a reference. Dashed line shows fit with the assumed period change dPP/dt = −7.11 × 10⁻¹¹ derived in Sect. 3.2. Dotted lines show fits of parabolae with the same dPP/dt separately to WASP and TESS data. Ordinate ranges one pulsation period. The two insets show zoomed-in images of TESS data, while the abscissa ticks are separated by 5 d. Bottom: residuals from the fits shown in the upper panel are phased with the orbital period of 23.08433 d. Red and green dots correspond to TESS and WASP data, respectively. Solid black line is a fit of Eq. (3) to the residual O−C data. Parameters of the fit are given in Table 2. Phase 0.0 corresponds to T0.
Current usage metrics show cumulative count of Article Views (full-text article views including HTML views, PDF and ePub downloads, according to the available data) and Abstracts Views on Vision4Press platform.
Data correspond to usage on the plateform after 2015. The current usage metrics is available 48-96 hours after online publication and is updated daily on week days.
Initial download of the metrics may take a while.