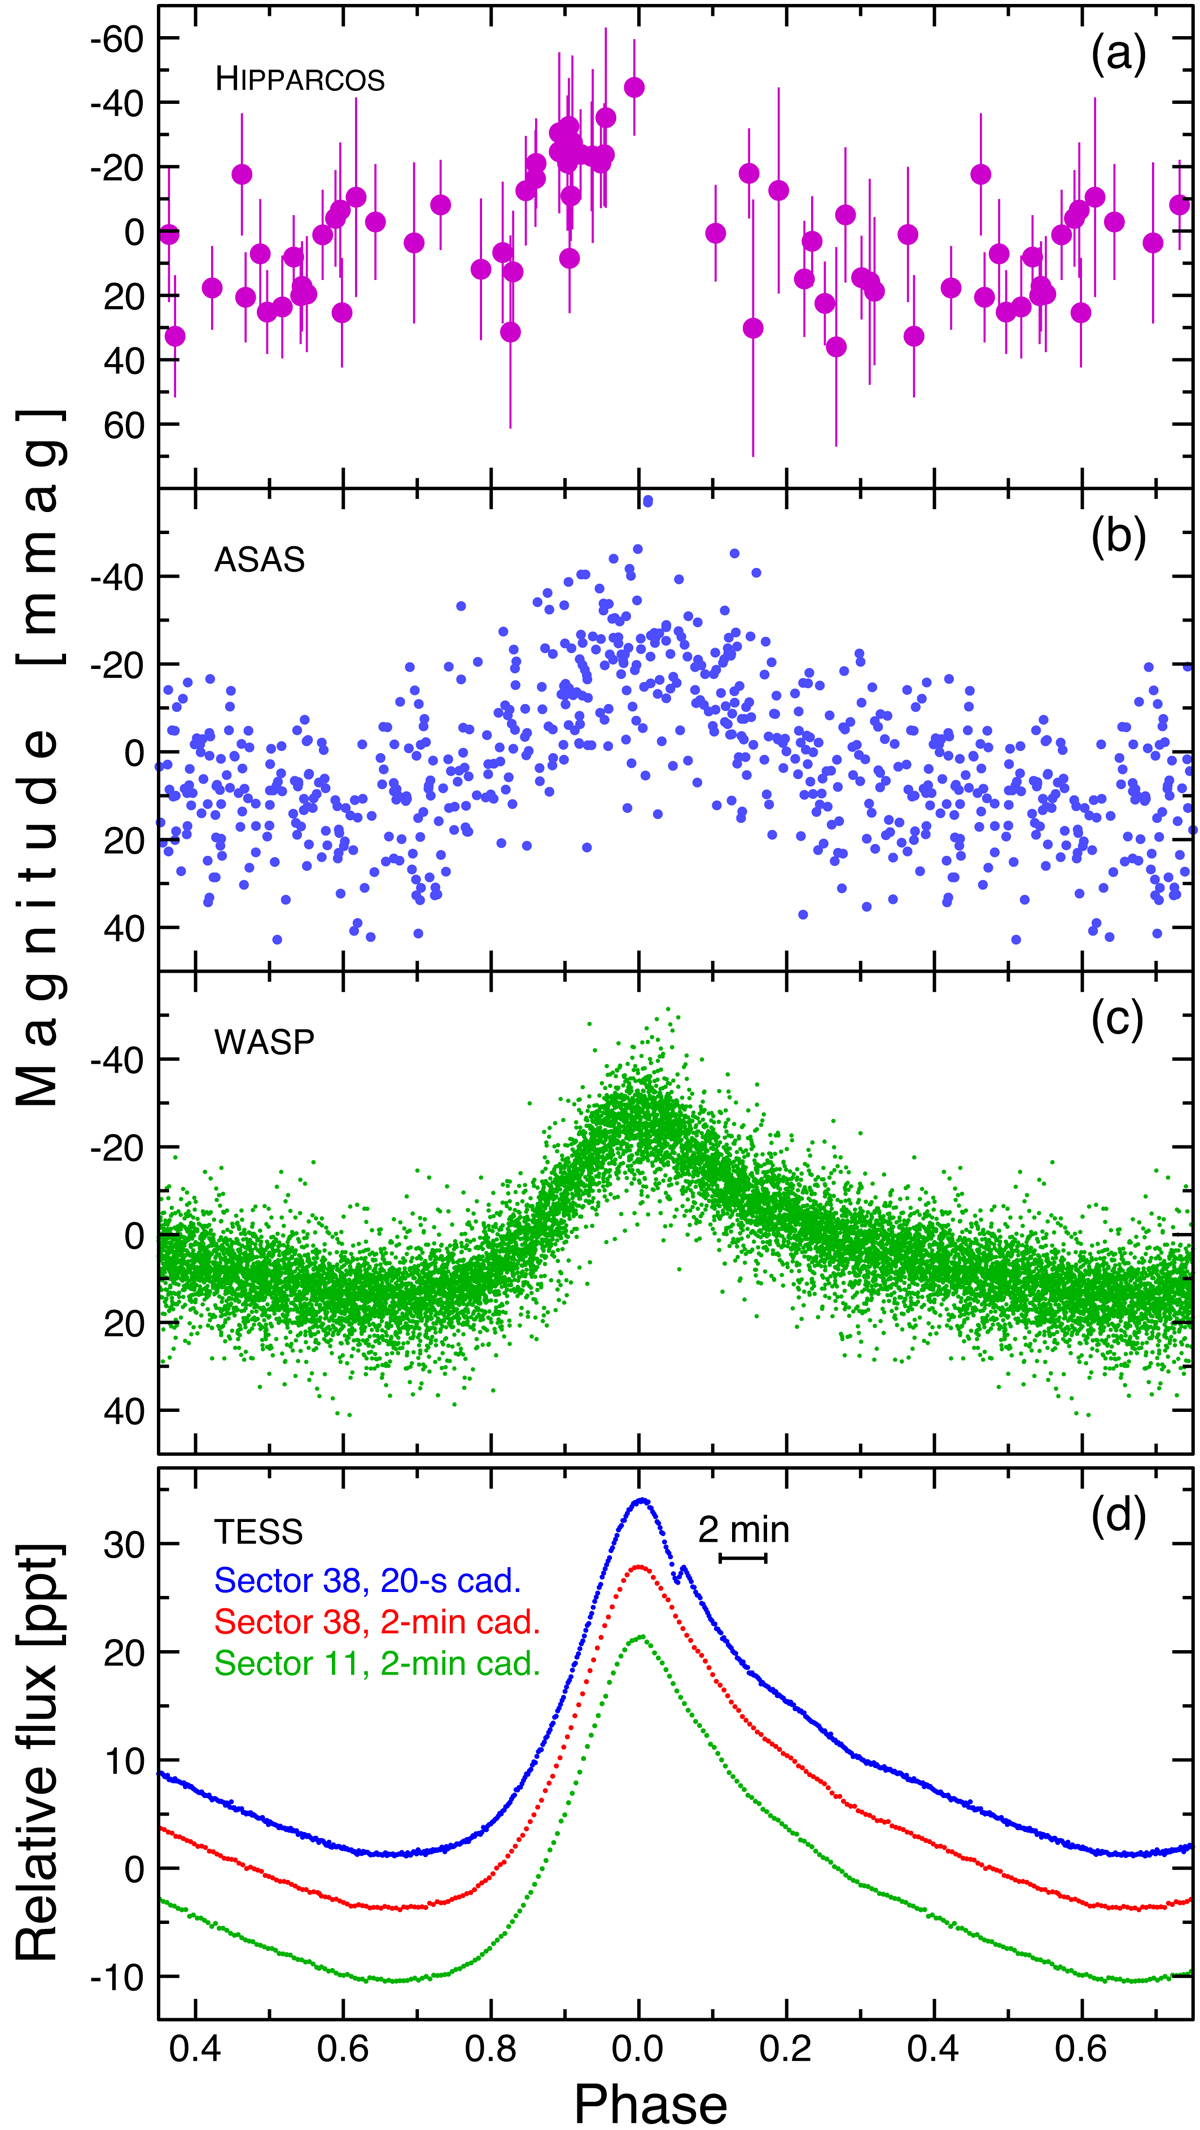
Fig. 3.
Download original image
Light curves of HD 133729 phased with pulsation period. (a)–(c): HIPPARCOS (a), ASAS (b), and WASP (c) light curves. (d) Phase-averaged TESS light curves in Sector 11 (green dots), Sector 38, 2-min cadence (red dots), and Sector 38, 20-s cadence (blue dots). For clarity, 5 ppt offsets were applied between the light curves. The 2-min cadence data are averaged in 0.005 phase intervals, and the 20-s cadence data are averaged in 0.002 phase intervals. Phase 0.0 corresponds to the time of maximum light.
Current usage metrics show cumulative count of Article Views (full-text article views including HTML views, PDF and ePub downloads, according to the available data) and Abstracts Views on Vision4Press platform.
Data correspond to usage on the plateform after 2015. The current usage metrics is available 48-96 hours after online publication and is updated daily on week days.
Initial download of the metrics may take a while.