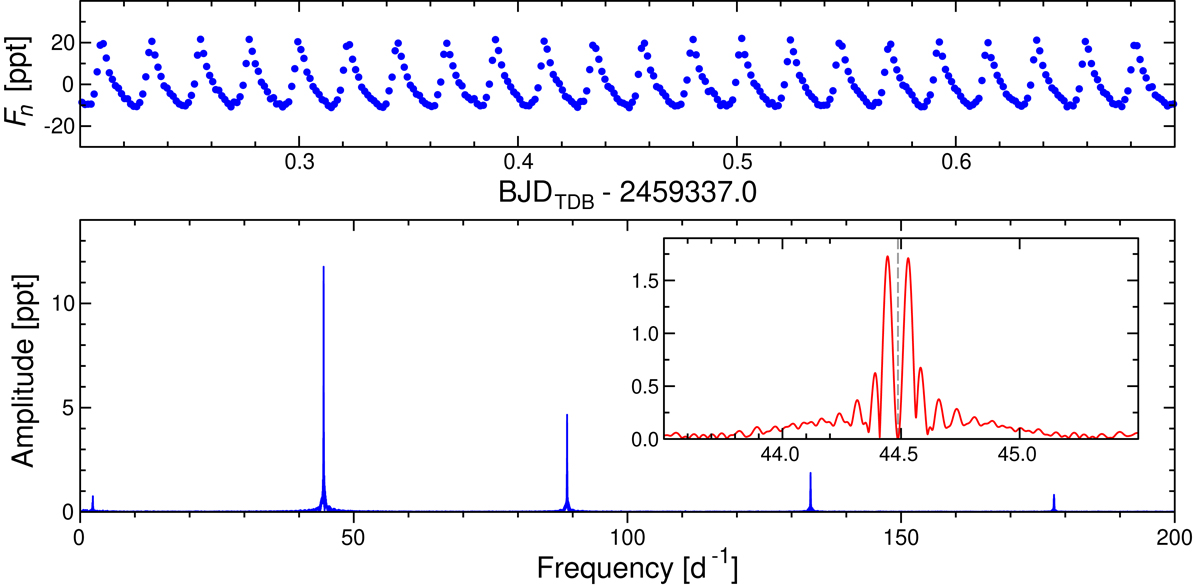
Fig. 1.
Download original image
Light curve and frequency spectrum of the TESS data of HD 133729. Top: half-day 2-min cadence TESS Sector 38 light curve of HD 133729. Fn stands for the relative flux Fi/⟨F⟩−1, where Fi is the TESS flux for the ith data point and ⟨F⟩ is average flux from all TESS observations in Sector 38. Bottom: frequency spectrum of the TESS Sector 38 data. In order to illustrate the occurrence of the ±0.043 d−1 orbital sidelobes, the inset shows a 2 d−1-wide frequency spectrum of the residuals in the vicinity of fP = 44.487 d−1, after subtracting fP and its harmonics.
Current usage metrics show cumulative count of Article Views (full-text article views including HTML views, PDF and ePub downloads, according to the available data) and Abstracts Views on Vision4Press platform.
Data correspond to usage on the plateform after 2015. The current usage metrics is available 48-96 hours after online publication and is updated daily on week days.
Initial download of the metrics may take a while.