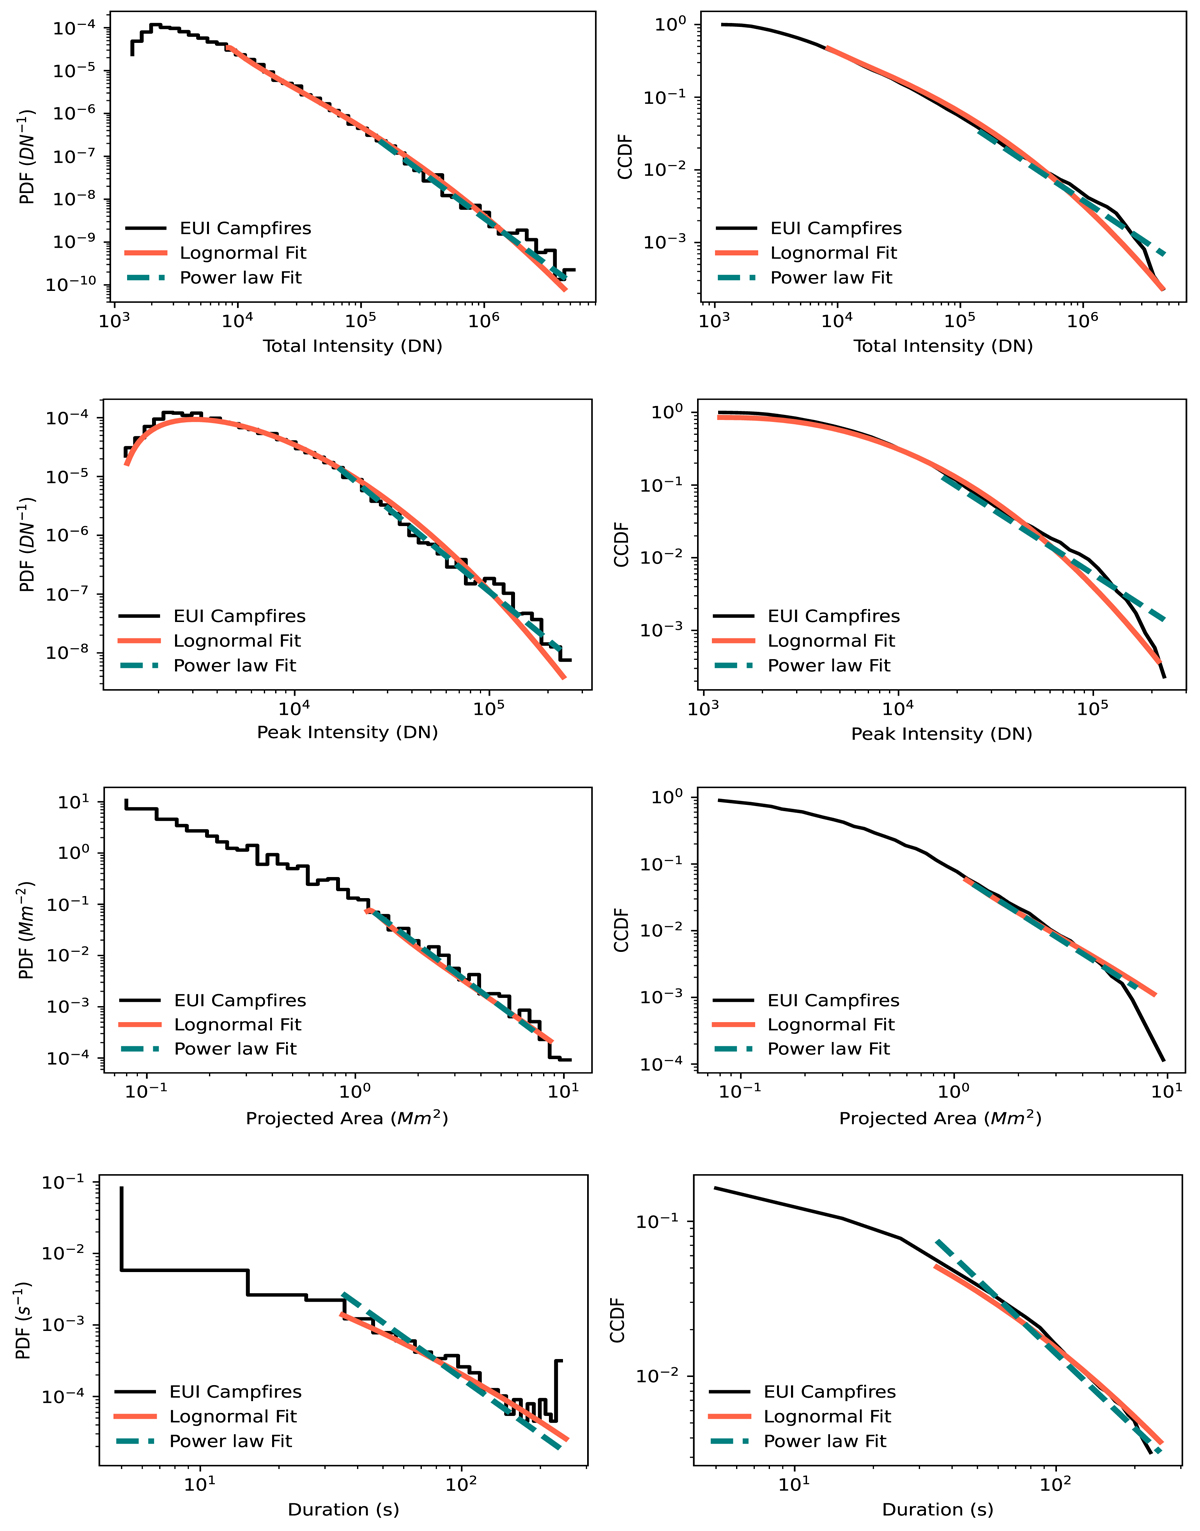
Fig. 8.
Download original image
Probability distribution function (PDF; left column) and complementary cumulative distribution function (CCDF; right column) of the total intensity (first row), peak intensity (second row), projected area (third row), and duration (fourth row) of campfires observed by HRIEUV (black line). Power laws (power law fit: blue dashed lines) and lognormal functions (lognormal fit: red line) are fitted to each distribution.
Current usage metrics show cumulative count of Article Views (full-text article views including HTML views, PDF and ePub downloads, according to the available data) and Abstracts Views on Vision4Press platform.
Data correspond to usage on the plateform after 2015. The current usage metrics is available 48-96 hours after online publication and is updated daily on week days.
Initial download of the metrics may take a while.