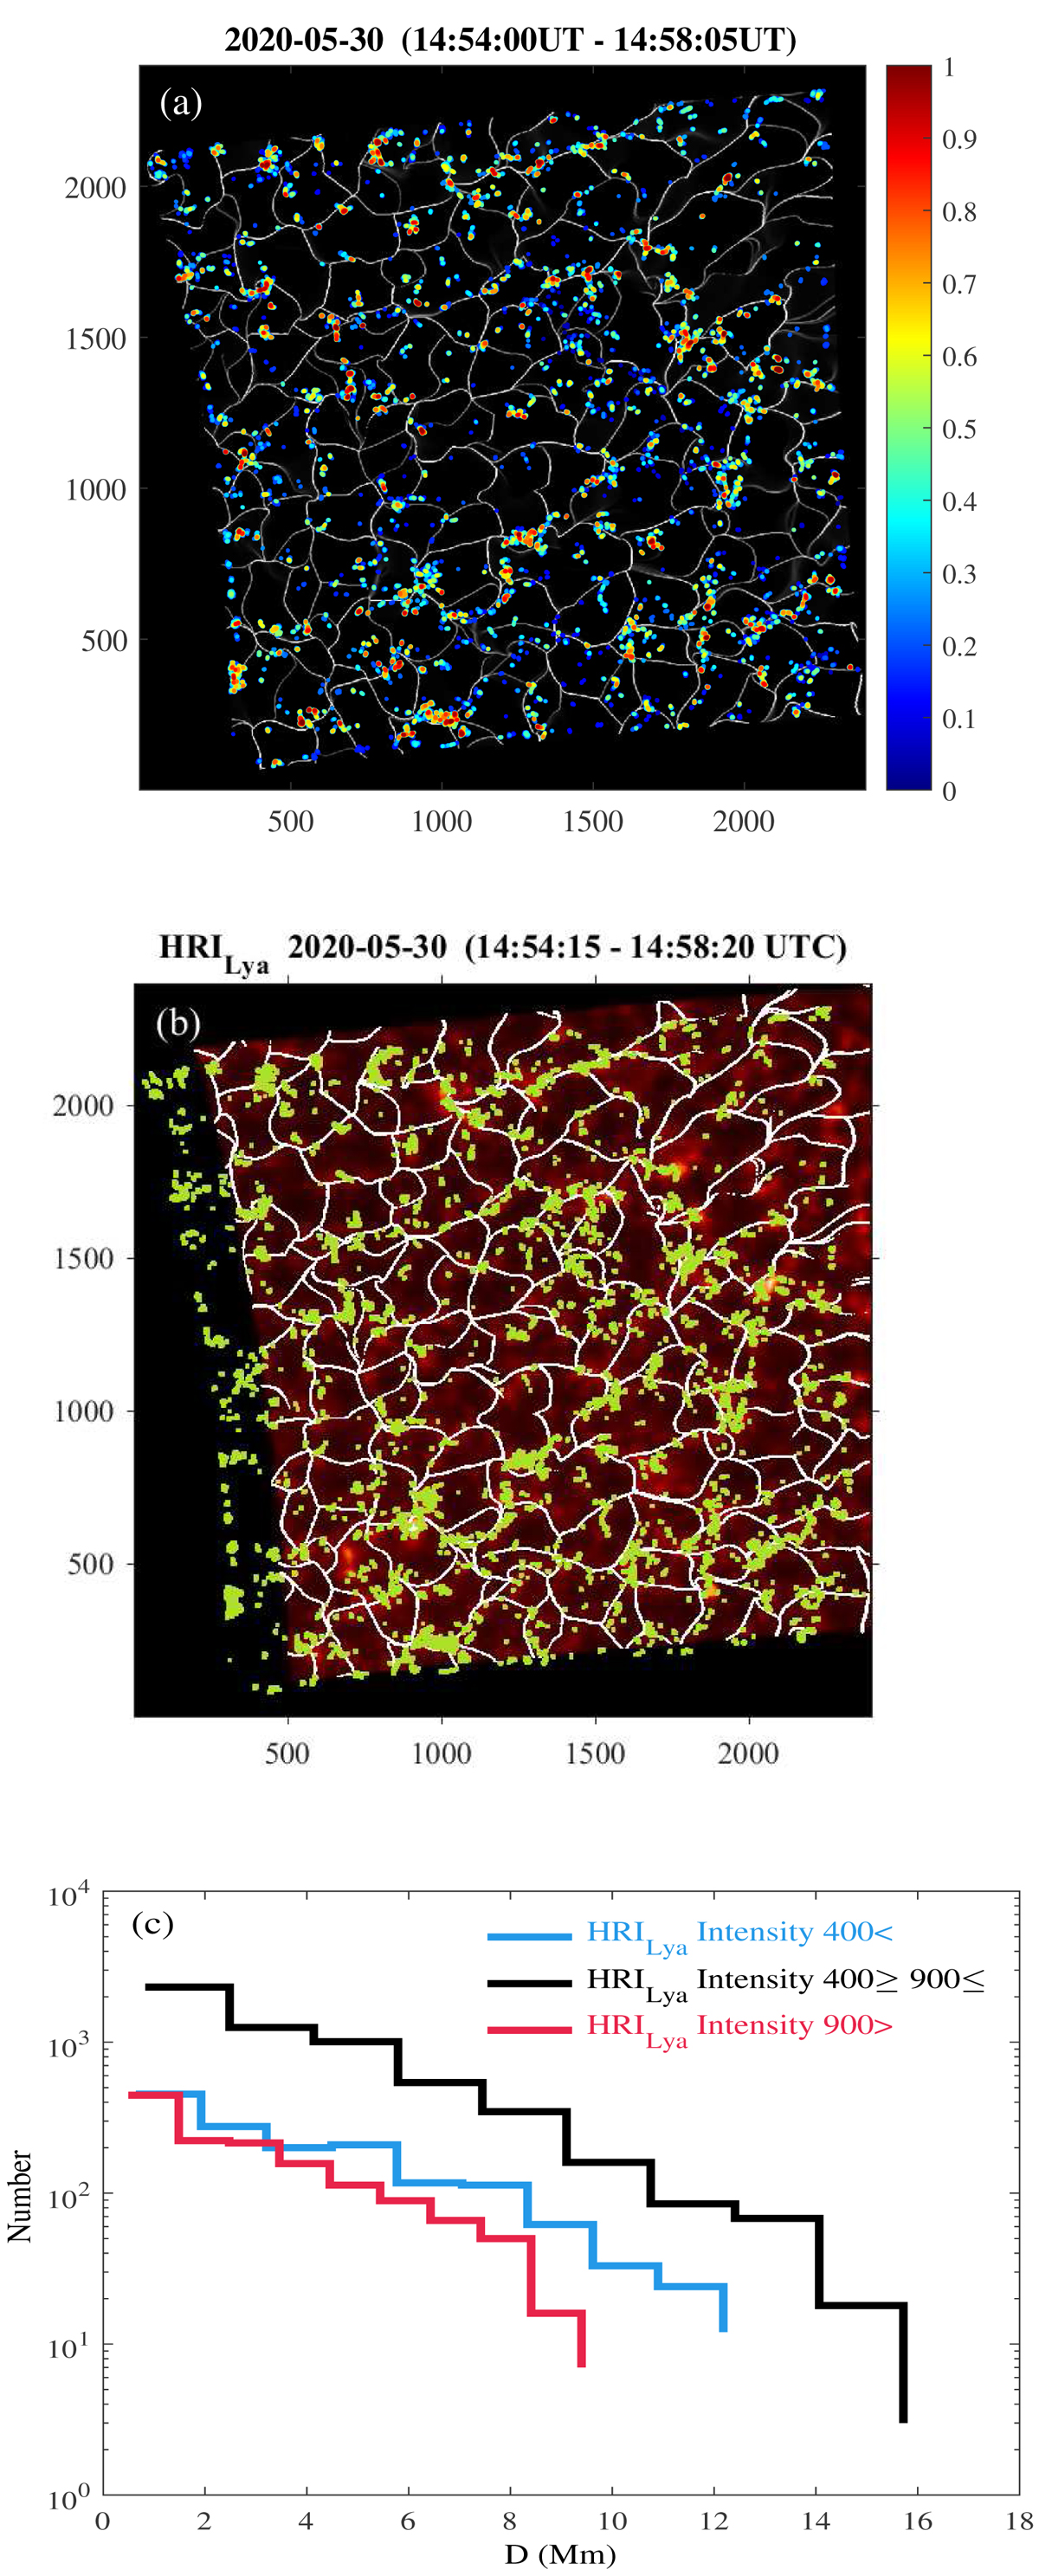
Fig. 7.
Download original image
(a) Position of 8678 campfires (color dots: the total intensity of campfires) and supergranular boundaries (white lines). The color map indicates the pixels’ integrated intensity of campfires. (b) Average of 50 HRILya images, supergranular boundaries (white lines), and position of campfires (green dots). (c) Frequency (number) of campfires’ shortest distances (distance (D) of campfires centroid from the supergranular boundaries) for HRILya intensity < 400 DN/s (blue line), 400–900 DN/s (black line), and > 900 DN/s (red line). About 2/3 of campfires have the HRILya intensity of the centroid in the range of 400–900 DN/s.
Current usage metrics show cumulative count of Article Views (full-text article views including HTML views, PDF and ePub downloads, according to the available data) and Abstracts Views on Vision4Press platform.
Data correspond to usage on the plateform after 2015. The current usage metrics is available 48-96 hours after online publication and is updated daily on week days.
Initial download of the metrics may take a while.