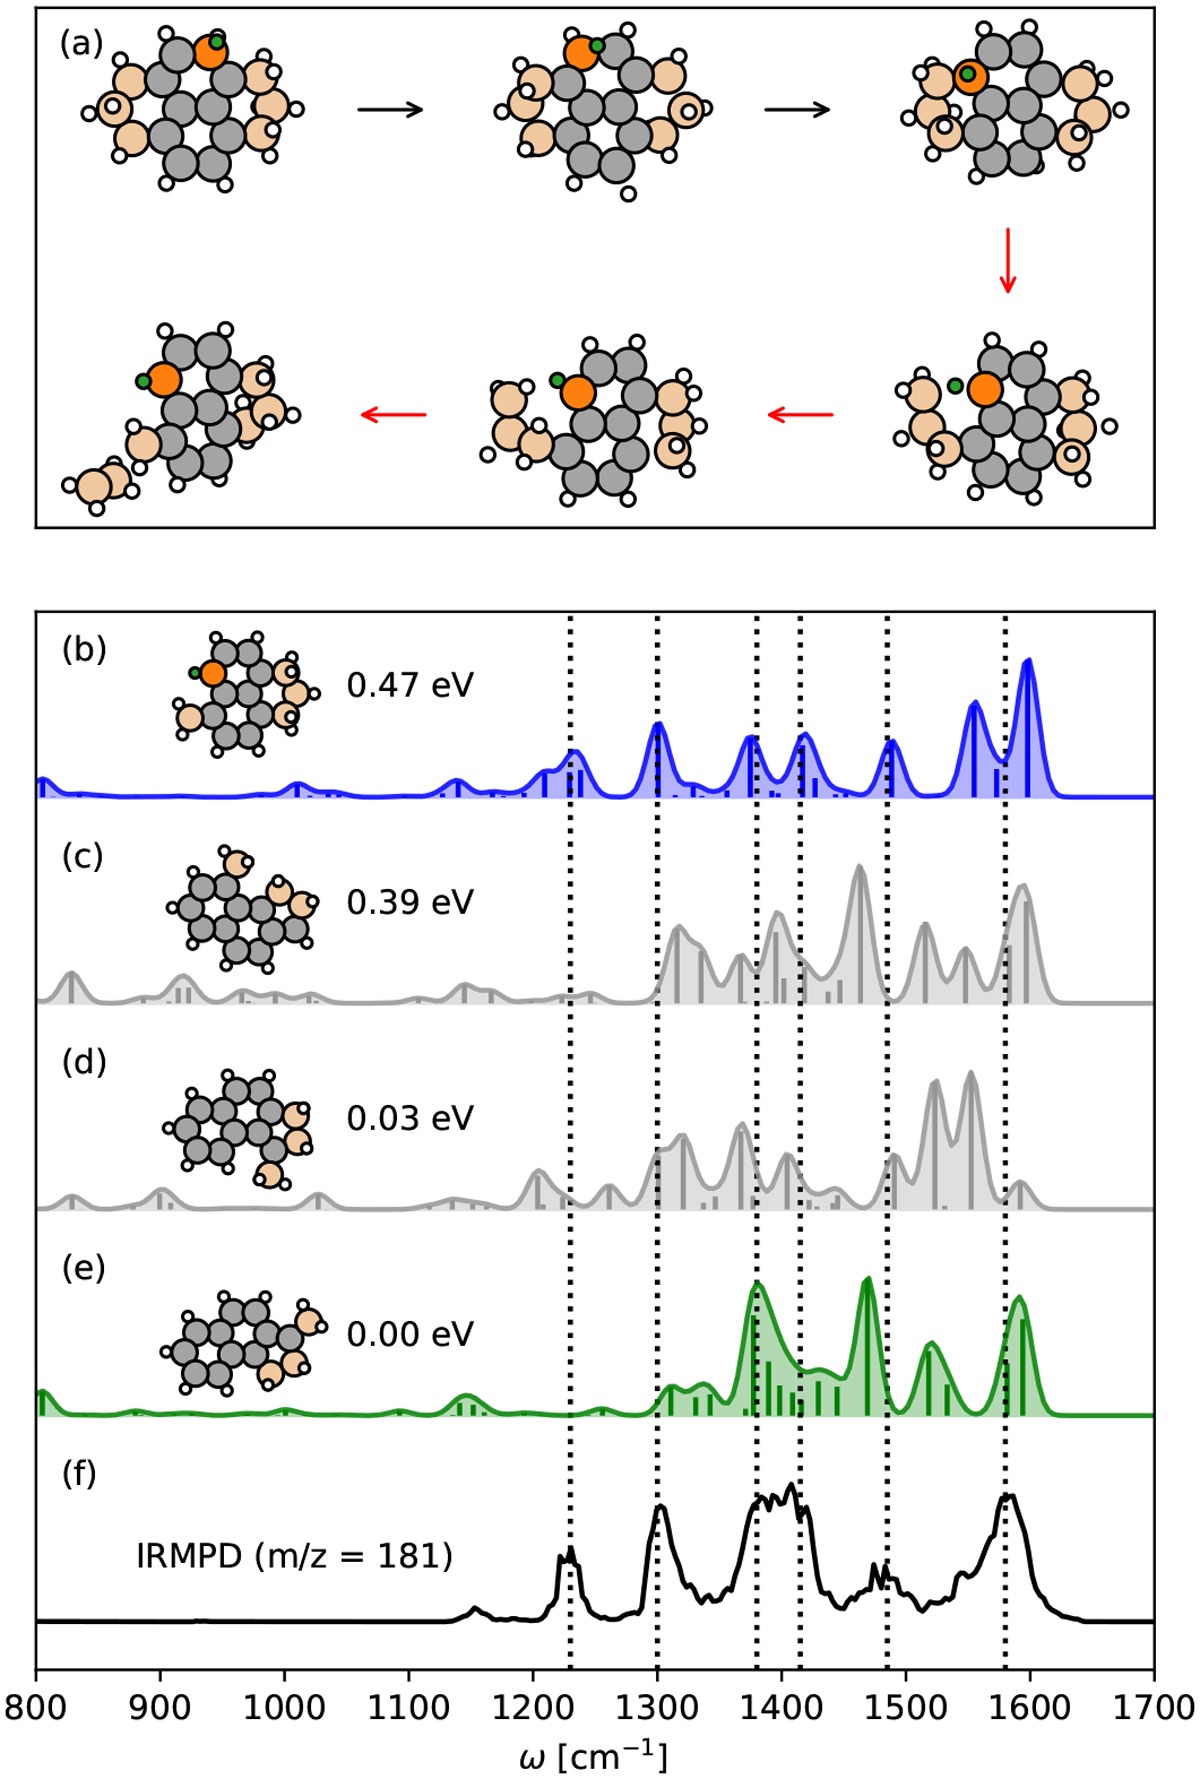
Fig. 2
Download original image
Identification of the fragment (m/z = 181). (a) The fragmentation pattern of [py + 7H]+ extracted from MD trajectories. The color scheme for atoms is the same as the scheme in Fig. 1. The hydrogen diffusion is indicated by black arrows and the process of ethylene formation is indicated by red arrows. The computed IR spectrum of (b) the MD-determined isomer, (c) the EA-determined isomer, (d) the EA-determined isomer, and (e) the EA-determined isomer with their structure snapshots and relative energies, (f) The experimental IR spectrum of the fragment (m/z = 181). Vertical dashed lines have been drawn to aid the comparison between theory and experiment.
Current usage metrics show cumulative count of Article Views (full-text article views including HTML views, PDF and ePub downloads, according to the available data) and Abstracts Views on Vision4Press platform.
Data correspond to usage on the plateform after 2015. The current usage metrics is available 48-96 hours after online publication and is updated daily on week days.
Initial download of the metrics may take a while.