Fig. 8
Download original image
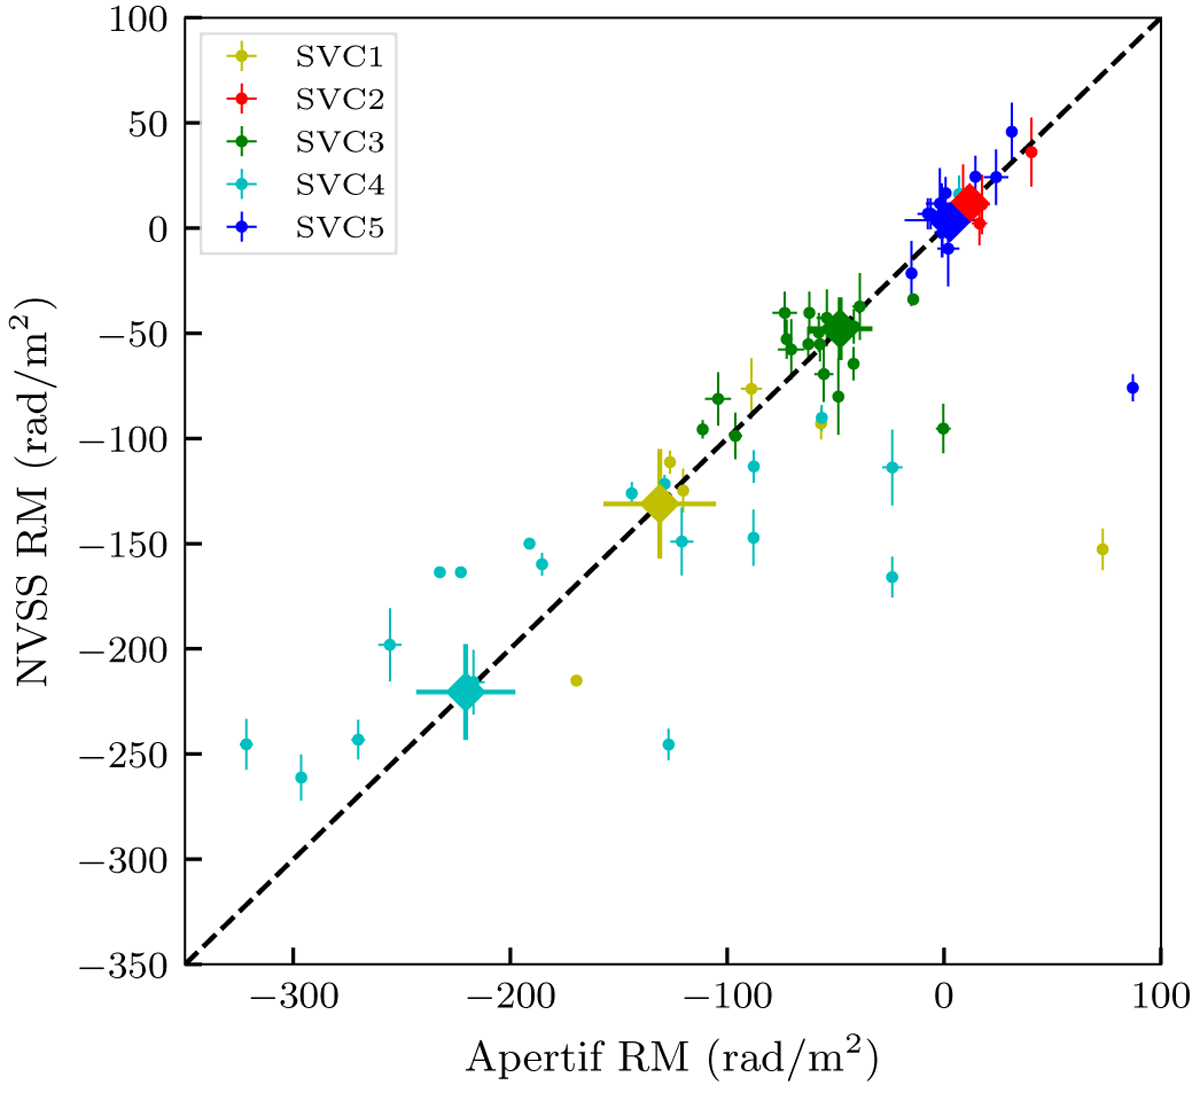
Rotation measures of the SVC sources plotted against the values of their NVSS counterparts from the NVSS RM catalogue (Taylor et al. 2009). Data from the different fields are marked with different colours. The diamonds show the RM value extracted from Oppermann et al. (2012) for the central pointing positions (see Table 4) of the five SVC fields. The dashed black line represents the 1:1 ratio of the RM values.
Current usage metrics show cumulative count of Article Views (full-text article views including HTML views, PDF and ePub downloads, according to the available data) and Abstracts Views on Vision4Press platform.
Data correspond to usage on the plateform after 2015. The current usage metrics is available 48-96 hours after online publication and is updated daily on week days.
Initial download of the metrics may take a while.