Free Access
Fig. 5
Download original image
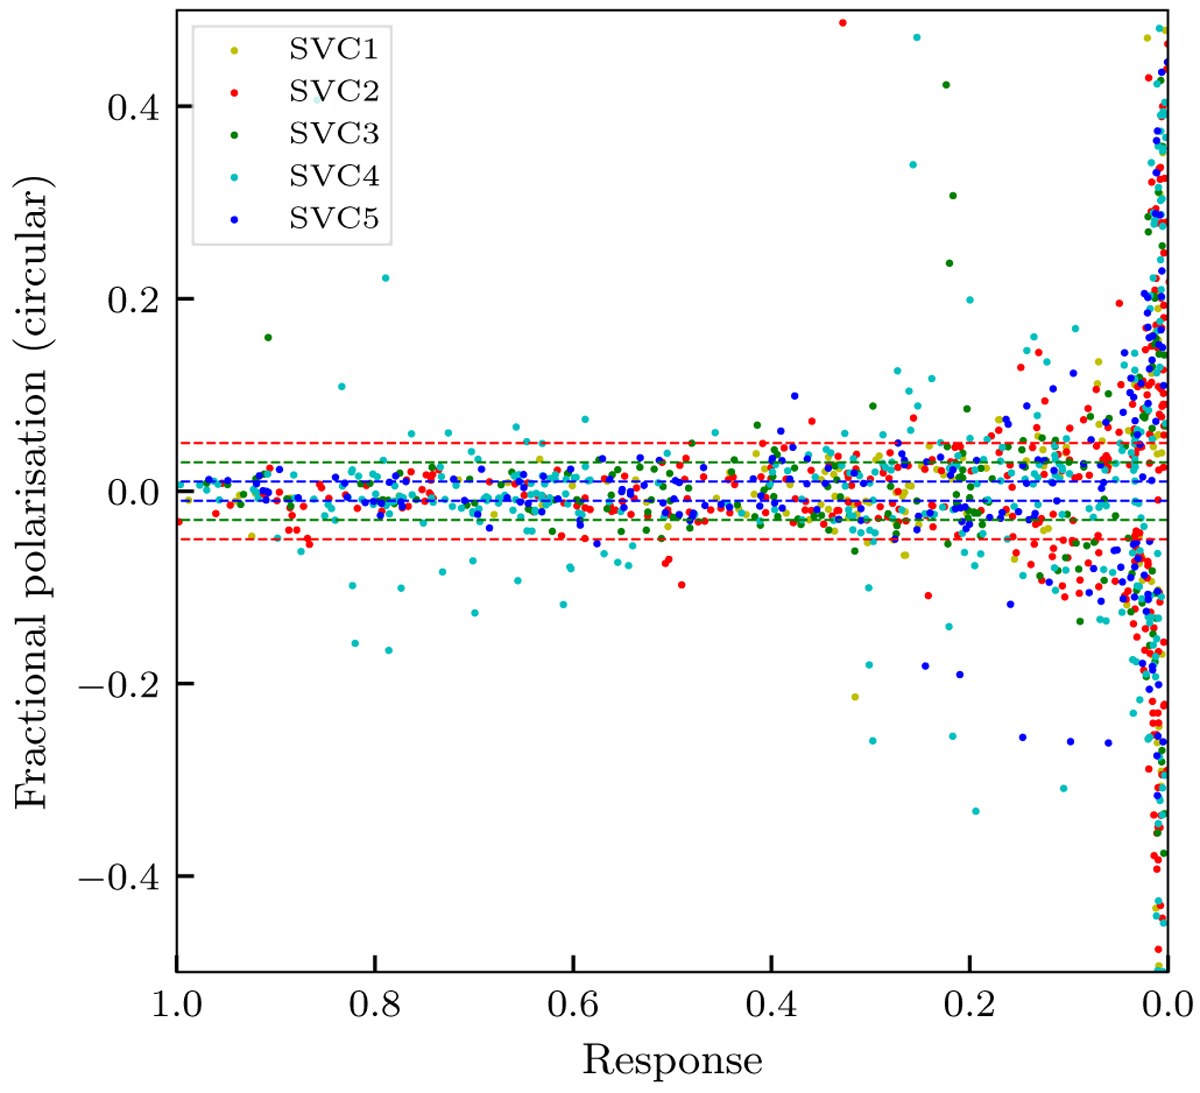
Primary beam responses of the detected sources in Stokes V vs. their fractional circular polarisation. The different colours mark the fields in which the sources were detected. The blue, green, and red dashed lines represent the 1%, 2%, and 3% fractional polarisation levels, respectively.
Current usage metrics show cumulative count of Article Views (full-text article views including HTML views, PDF and ePub downloads, according to the available data) and Abstracts Views on Vision4Press platform.
Data correspond to usage on the plateform after 2015. The current usage metrics is available 48-96 hours after online publication and is updated daily on week days.
Initial download of the metrics may take a while.