Fig. 17
Download original image
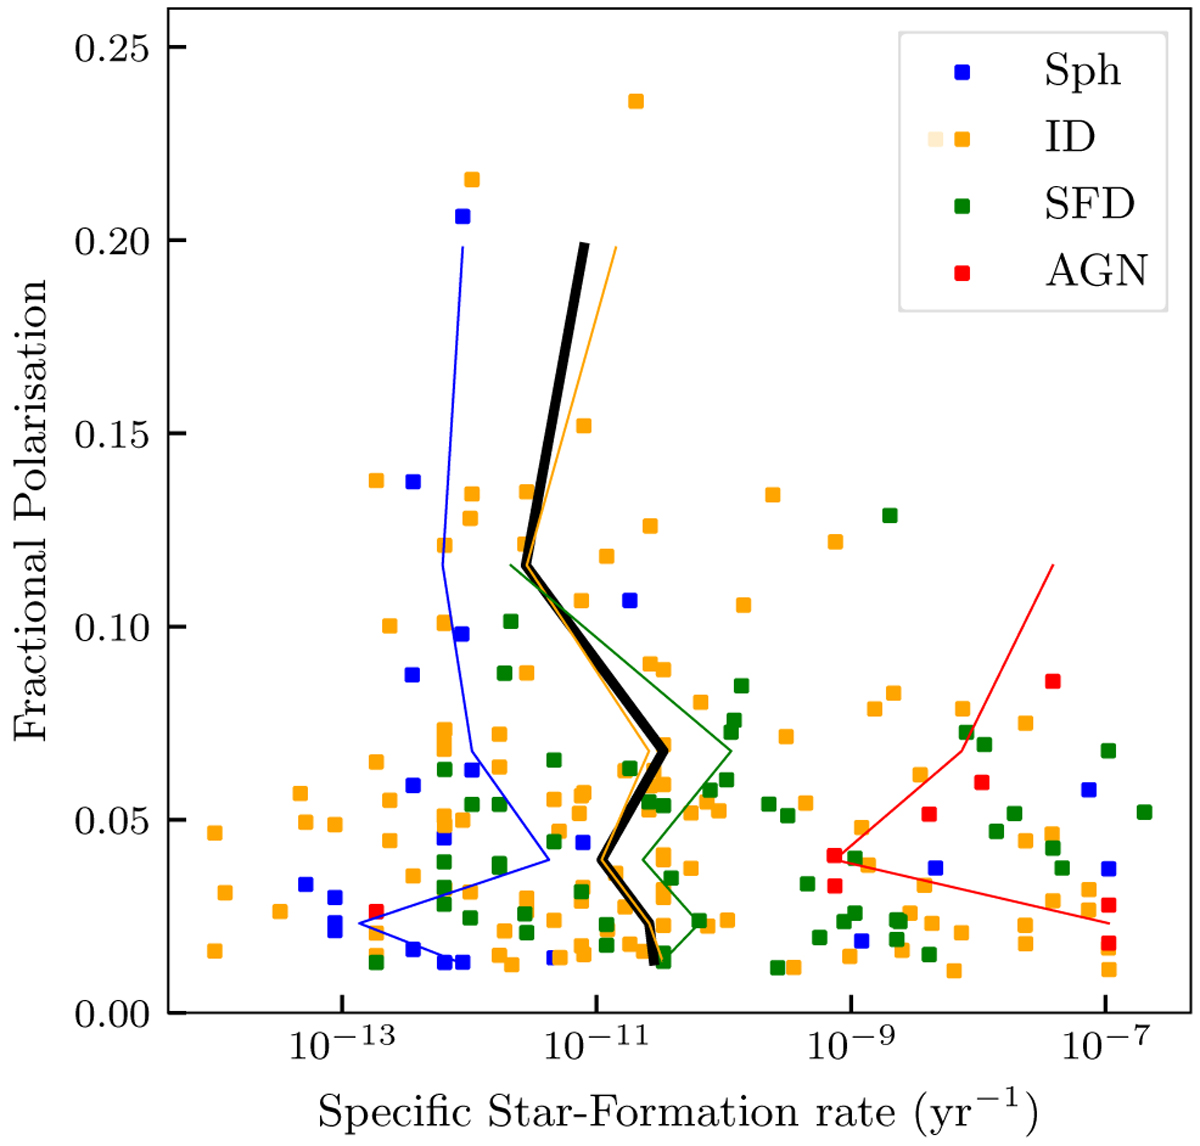
sSFR vs. the fractional polarisation of our host galaxies by galaxy type (see Sect. 6.1). Data points are colour coded according to host galaxy type as described in Fig. 15. The solid lines represent the median values over logarithmically derived bins for each host galaxy type. The black line represents the median values for the whole galaxy sample.
Current usage metrics show cumulative count of Article Views (full-text article views including HTML views, PDF and ePub downloads, according to the available data) and Abstracts Views on Vision4Press platform.
Data correspond to usage on the plateform after 2015. The current usage metrics is available 48-96 hours after online publication and is updated daily on week days.
Initial download of the metrics may take a while.