Fig. 11
Download original image
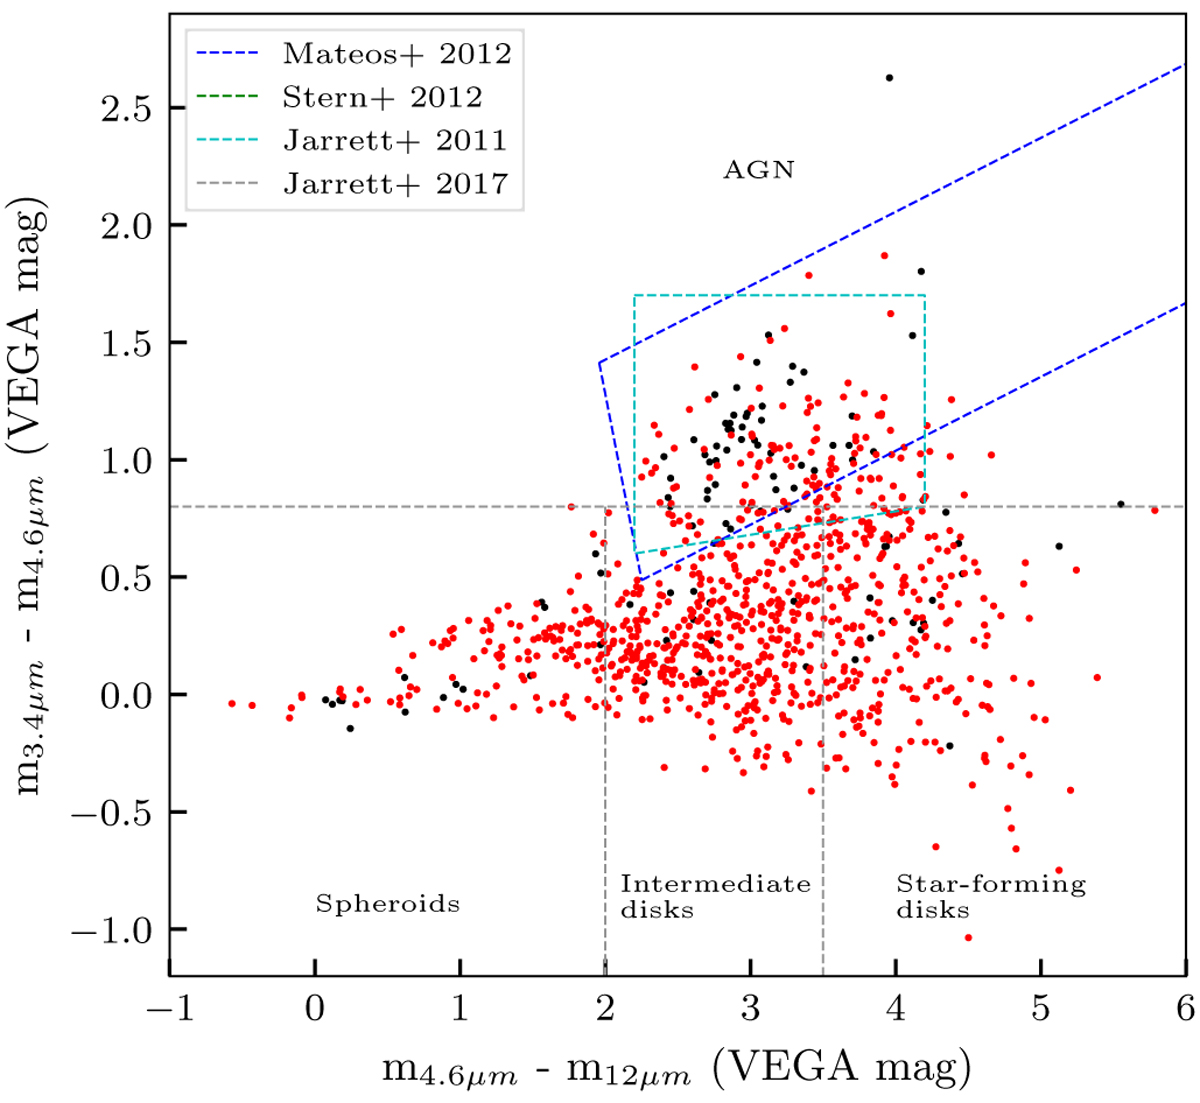
AllWISE 3.4–4.6 µm brightness vs. 4.6–12 µm brightness. All values are given in Vega magnitudes. Black and red dots represent HS/N and LS/N sources, respectively. The green, cyan, and blue dashed lines illustrate the AGN-selection criteria from Stern et al. (2012), Jarrett et al. (2011), and Mateos et al. (2012), respectively. The grey dashed lines divide the diagram into regions where AGN, spheroids, intermediate disc galaxies, and star-forming galaxies are positioned following the criteria in Jarrett et al. (2017).
Current usage metrics show cumulative count of Article Views (full-text article views including HTML views, PDF and ePub downloads, according to the available data) and Abstracts Views on Vision4Press platform.
Data correspond to usage on the plateform after 2015. The current usage metrics is available 48-96 hours after online publication and is updated daily on week days.
Initial download of the metrics may take a while.