Fig. 7.
Download original image
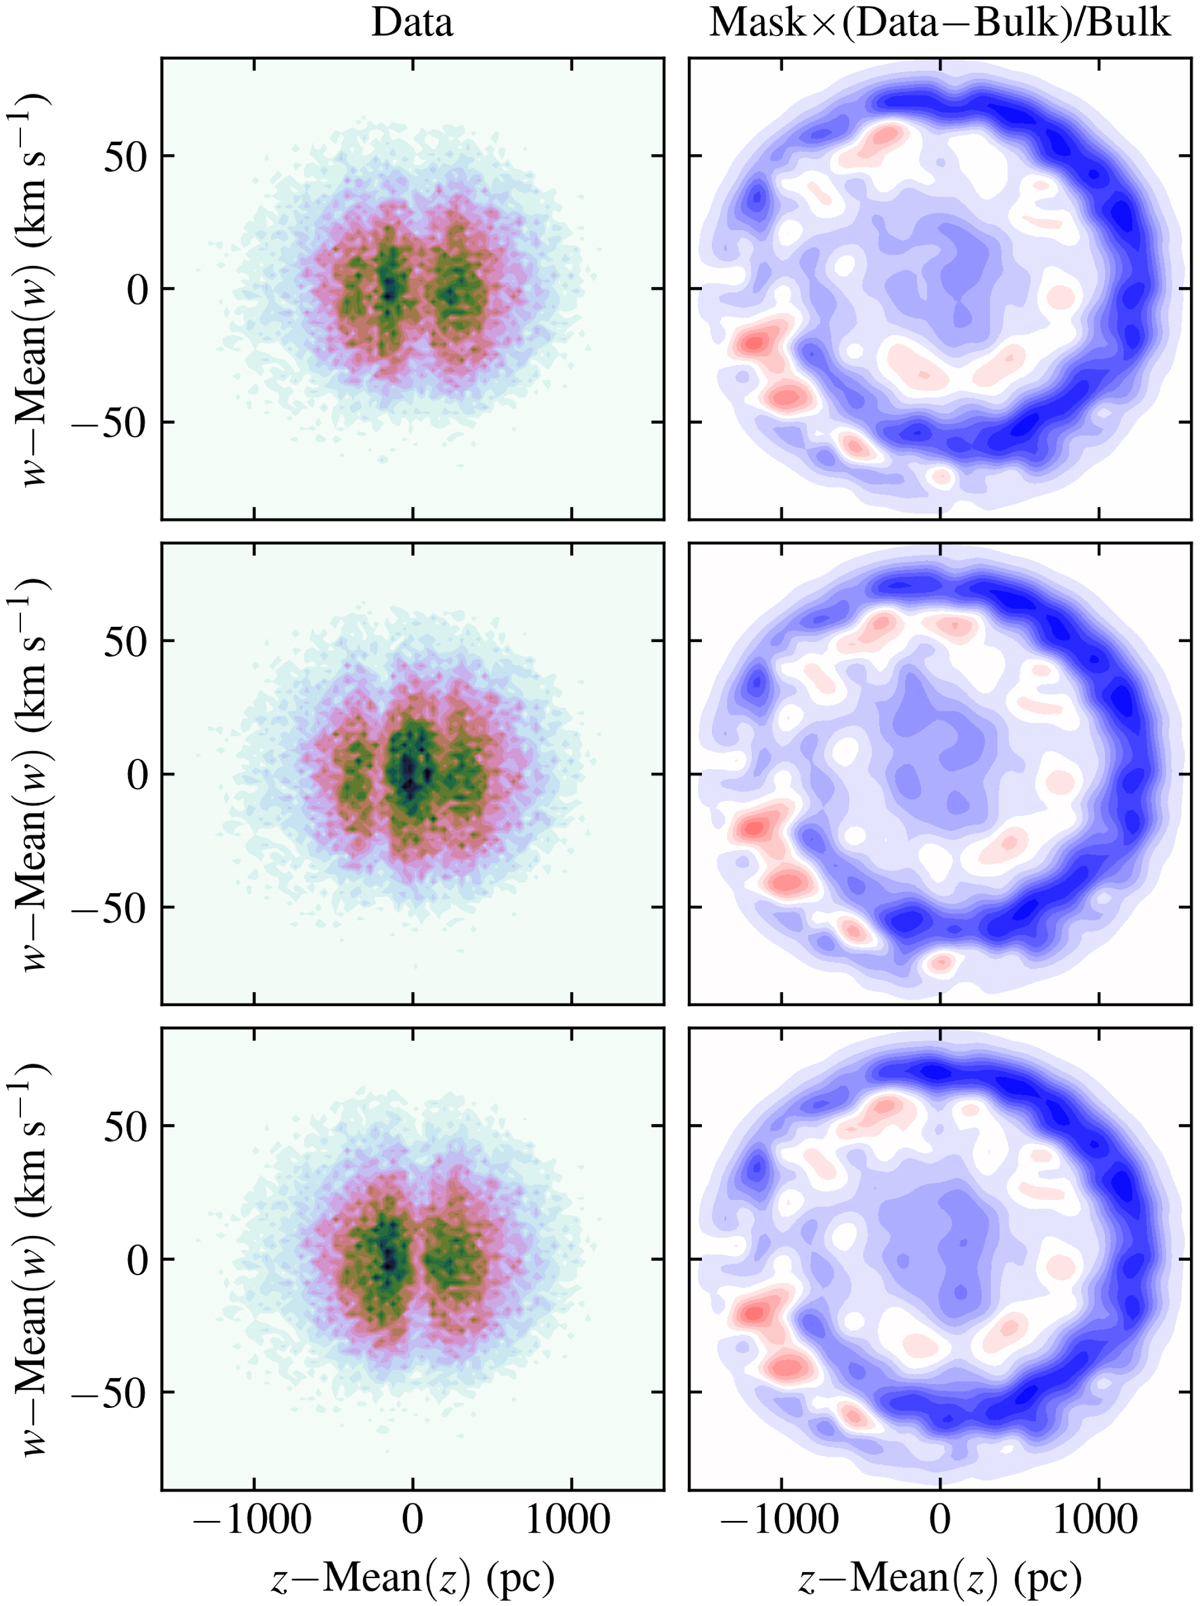
Data histograms affected by extinction functions (which are described in Sect. 3). The three examples correspond to extinction functions indices 1–3 (from top to bottom), for the data sample with ![]() and
and ![]() . Left- and right-hand panels correspond to panels b and c in Fig. 3 (although the “bulk” also includes the fitted mask function). The axis ranges are shared between all panels.
. Left- and right-hand panels correspond to panels b and c in Fig. 3 (although the “bulk” also includes the fitted mask function). The axis ranges are shared between all panels.
Current usage metrics show cumulative count of Article Views (full-text article views including HTML views, PDF and ePub downloads, according to the available data) and Abstracts Views on Vision4Press platform.
Data correspond to usage on the plateform after 2015. The current usage metrics is available 48-96 hours after online publication and is updated daily on week days.
Initial download of the metrics may take a while.