Free Access
Fig. 4.
Download original image
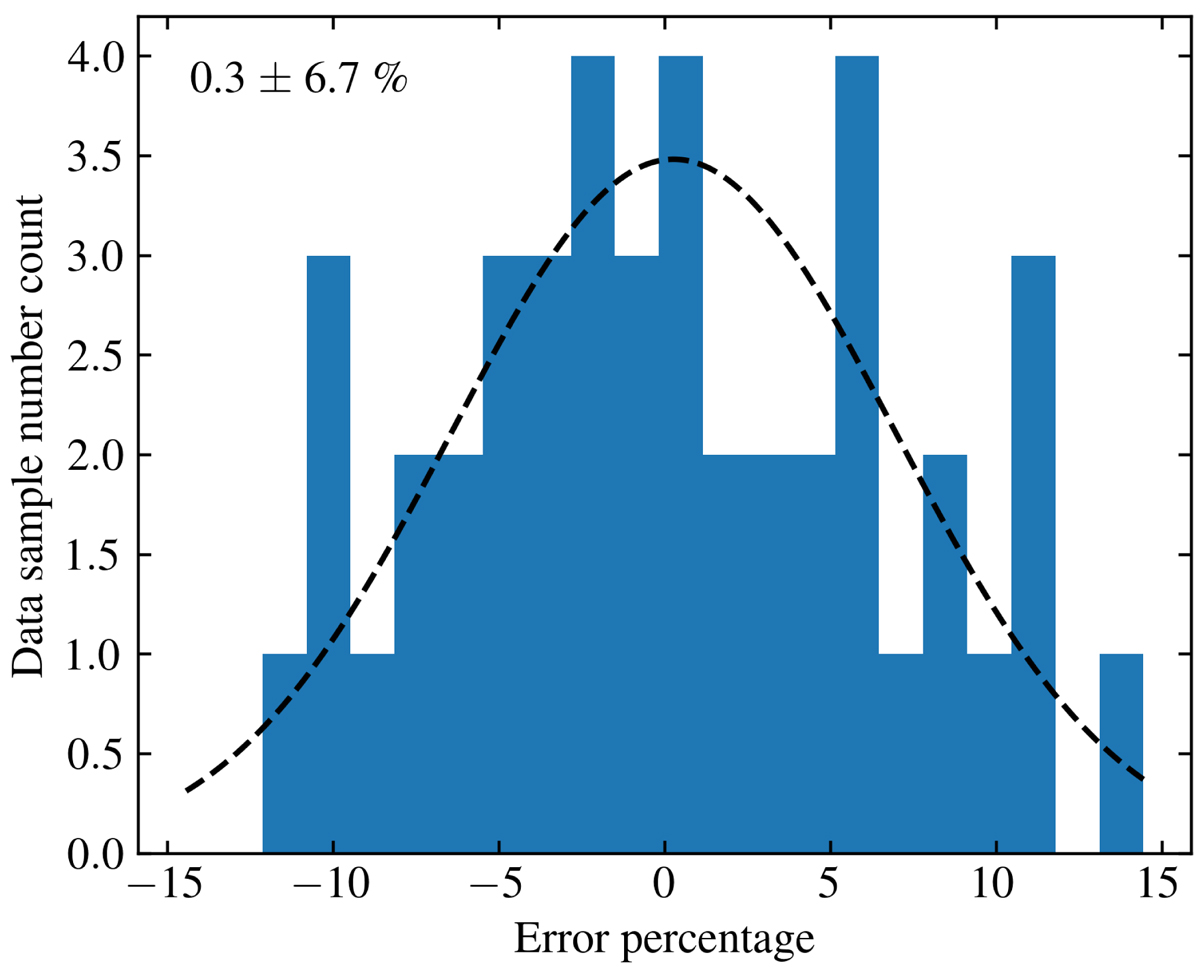
Histogram of relative errors, for the quantity Φ(1 kpc). The dashed black line corresponds to a Gaussian distribution whose mean and standard deviation is given by the distribution of relative errors, which are also written in the top left corner.
Current usage metrics show cumulative count of Article Views (full-text article views including HTML views, PDF and ePub downloads, according to the available data) and Abstracts Views on Vision4Press platform.
Data correspond to usage on the plateform after 2015. The current usage metrics is available 48-96 hours after online publication and is updated daily on week days.
Initial download of the metrics may take a while.