Free Access
Fig. 3.
Download original image
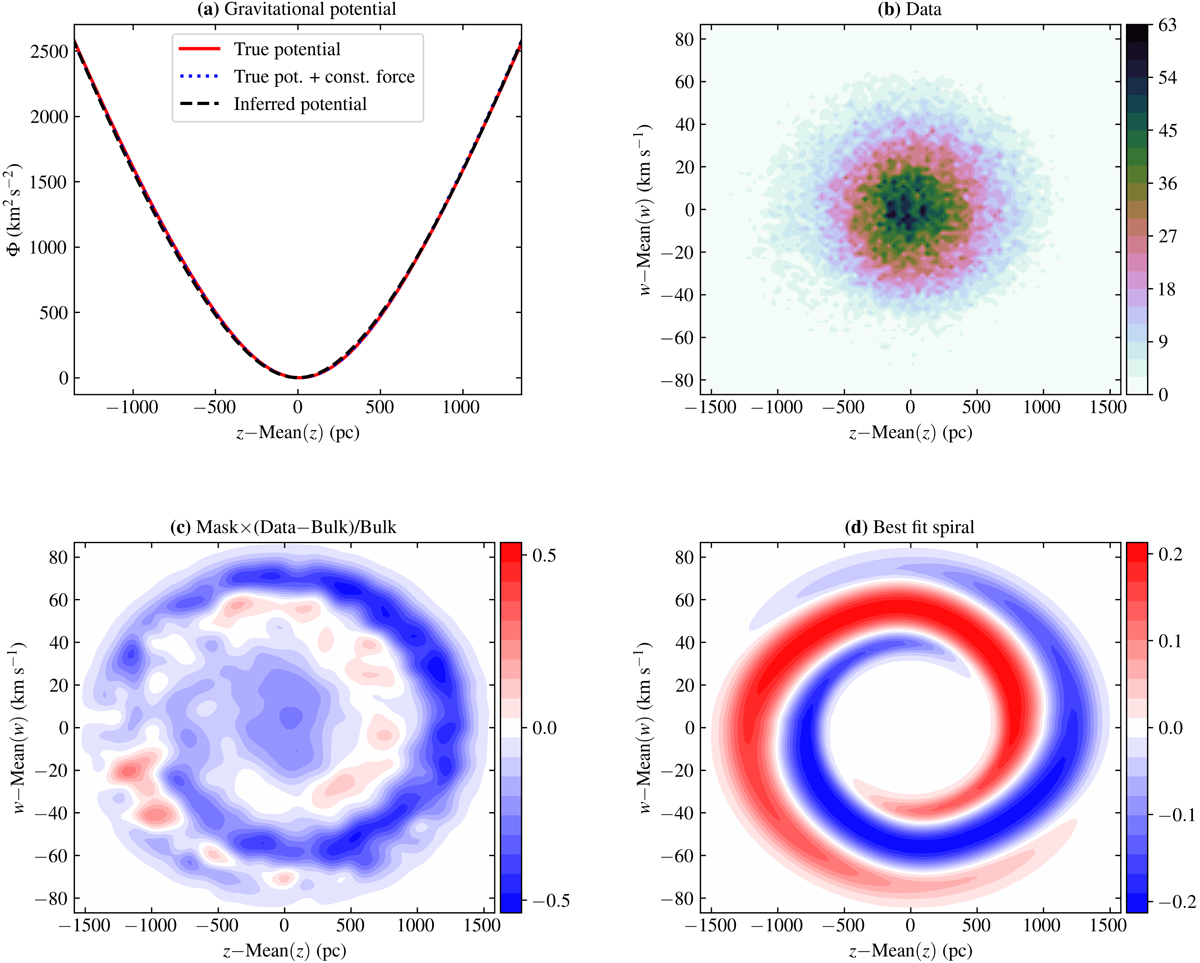
Data and fitted phase-space density of the data sample with ![]() and
and ![]() . The four panels show: (a) the data histogram; (b) the fitted bulk density; (c) the residual phase-space density with respect to the fitted bulk; (d) the relative phase-space density perturbation of the best fit spiral.
. The four panels show: (a) the data histogram; (b) the fitted bulk density; (c) the residual phase-space density with respect to the fitted bulk; (d) the relative phase-space density perturbation of the best fit spiral.
Current usage metrics show cumulative count of Article Views (full-text article views including HTML views, PDF and ePub downloads, according to the available data) and Abstracts Views on Vision4Press platform.
Data correspond to usage on the plateform after 2015. The current usage metrics is available 48-96 hours after online publication and is updated daily on week days.
Initial download of the metrics may take a while.