Free Access
Fig. 1.
Download original image
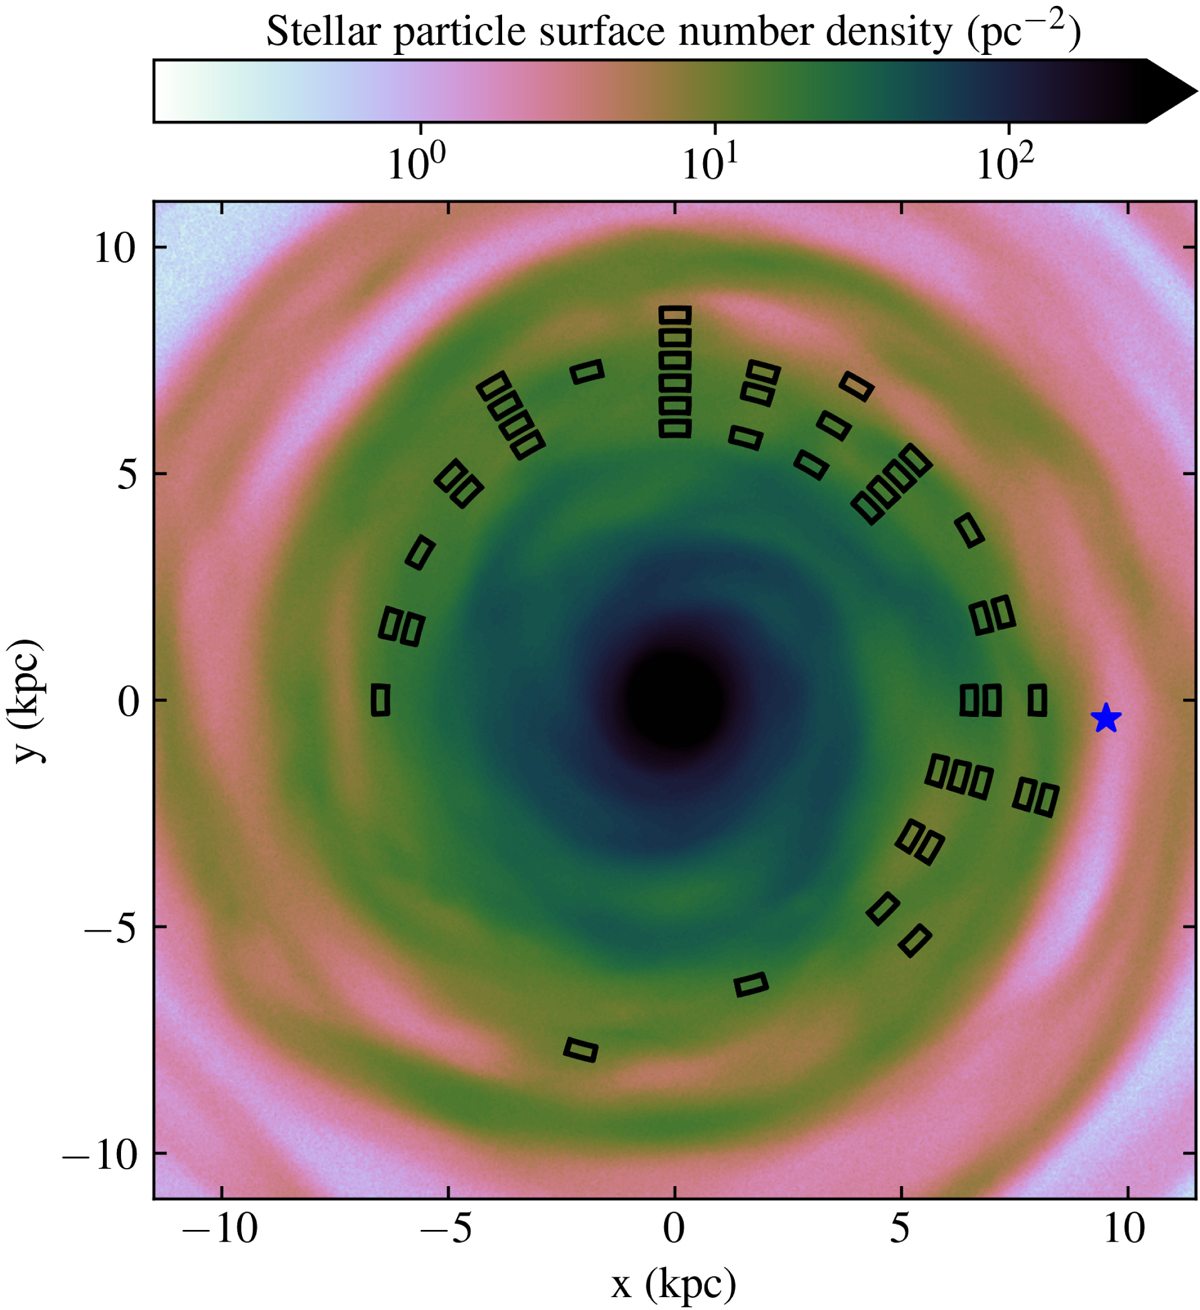
Stellar surface density of the simulation snapshot, with overlaid black squares corresponding to the areas of our data samples. The star marks the location of the perturbing satellite in the (x, y)-plane.
Current usage metrics show cumulative count of Article Views (full-text article views including HTML views, PDF and ePub downloads, according to the available data) and Abstracts Views on Vision4Press platform.
Data correspond to usage on the plateform after 2015. The current usage metrics is available 48-96 hours after online publication and is updated daily on week days.
Initial download of the metrics may take a while.