Fig. 6.
Download original image
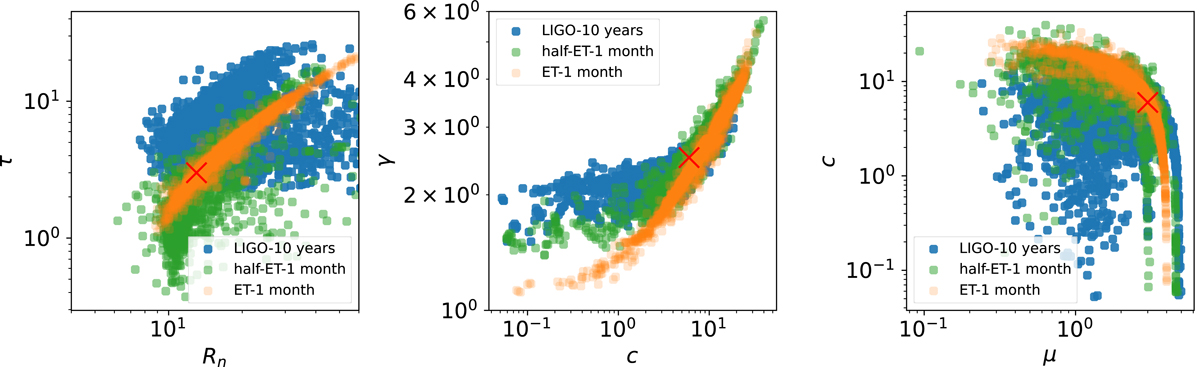
Correlation between the parameters of redshift dependence (Rn, τ, left panel) and among the parameters of mass function (μ, c, γ, middle and right panel). Blue markers correspond to 10 yr of observations with aLIGO; green markers correspond to 1 month of observations with half-ET, and orange markers correspond to 1 month of observations with ET. The red cross in each panel marks the location of the true values that were used to generate the observed catalogue.
Current usage metrics show cumulative count of Article Views (full-text article views including HTML views, PDF and ePub downloads, according to the available data) and Abstracts Views on Vision4Press platform.
Data correspond to usage on the plateform after 2015. The current usage metrics is available 48-96 hours after online publication and is updated daily on week days.
Initial download of the metrics may take a while.