Fig. 5.
Download original image
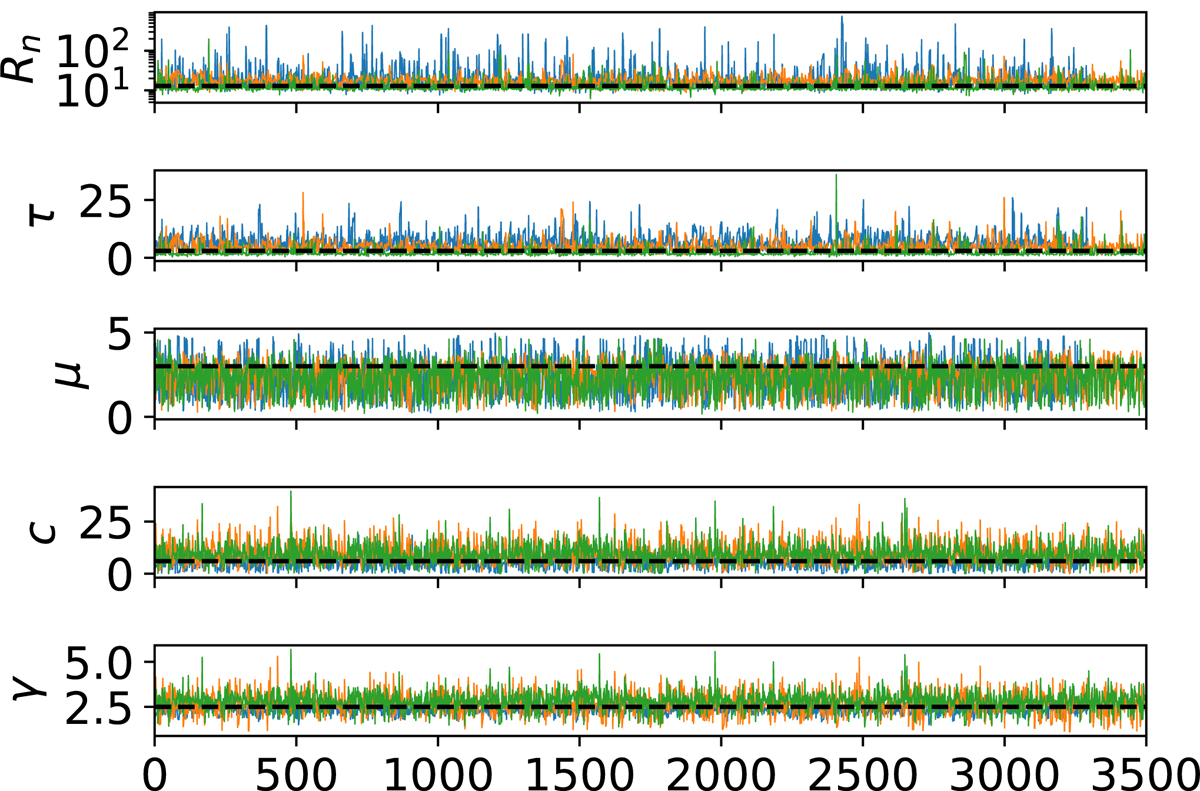
MCMC chains sampled from the posterior distribution of the population parameters. The blue line is for the 10 yr of aLIGO observations, the green line is for the month of observations with half-ET, and the orange line is for the month of observations with full ET. The black dashed lines mark the true values of the corresponding parameters, which were used to generate the observed catalogue.
Current usage metrics show cumulative count of Article Views (full-text article views including HTML views, PDF and ePub downloads, according to the available data) and Abstracts Views on Vision4Press platform.
Data correspond to usage on the plateform after 2015. The current usage metrics is available 48-96 hours after online publication and is updated daily on week days.
Initial download of the metrics may take a while.