Fig. 7.
Download original image
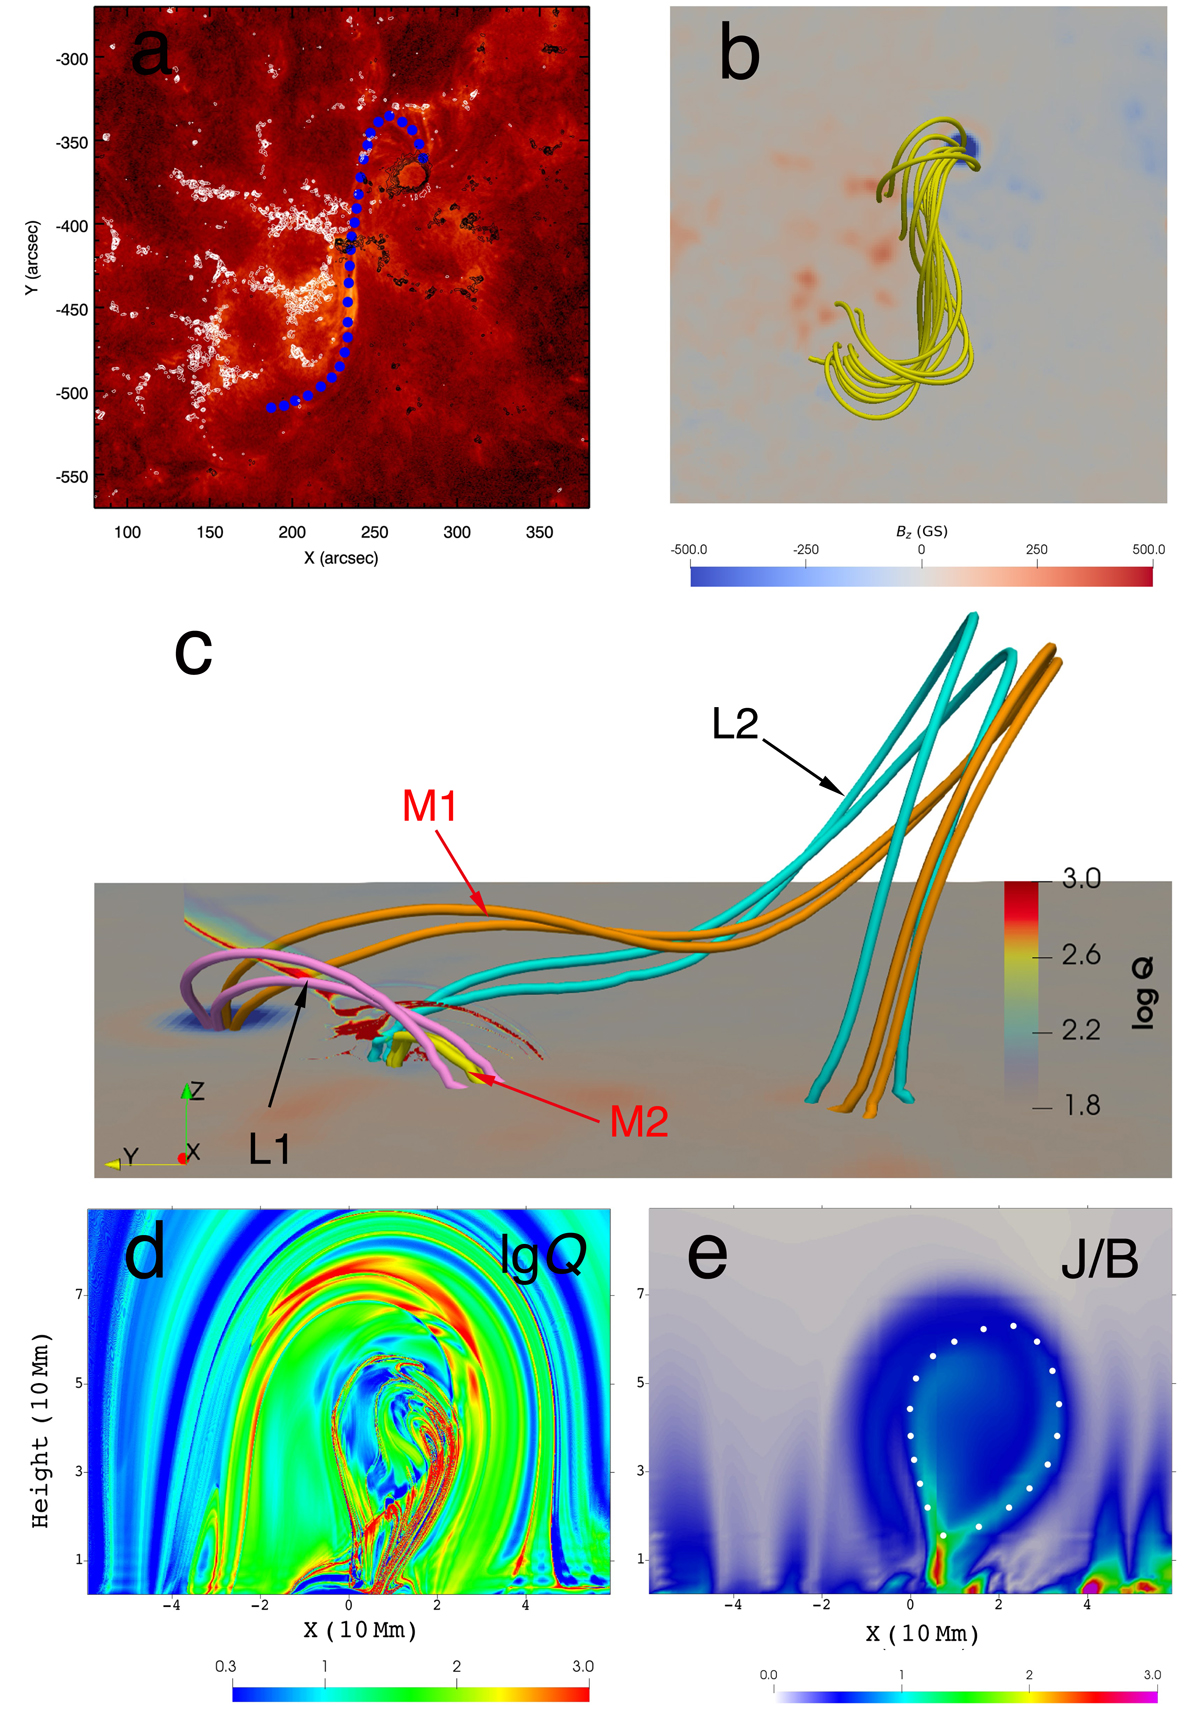
3D magnetic configuration of the FC. Panel a: AIA 304 Å image with the dotted curve overlaid showing the path of the FC. Panel b: collection of 3D magnetic field lines indicating the MFR as seen from the top. The bottom boundary is the HMI LOS magnetogram. Panel c: side view of panel b coupled with Q values. L1 and L2 delineate two groups of sheared arcades, and M1 and M2 represent the MFR field lines and small flare loops, respectively. The coordinates x, y, and z represent west, north, and altitude. Panel d: distribution of Q values on the plane perpendicular to the MFR axis, as pointed out by the dashed line in panel b. Panel e: distribution of J/B in the same plane and the dotted line indicates the outer boundary of the MFR.
Current usage metrics show cumulative count of Article Views (full-text article views including HTML views, PDF and ePub downloads, according to the available data) and Abstracts Views on Vision4Press platform.
Data correspond to usage on the plateform after 2015. The current usage metrics is available 48-96 hours after online publication and is updated daily on week days.
Initial download of the metrics may take a while.