Fig. 6.
Download original image
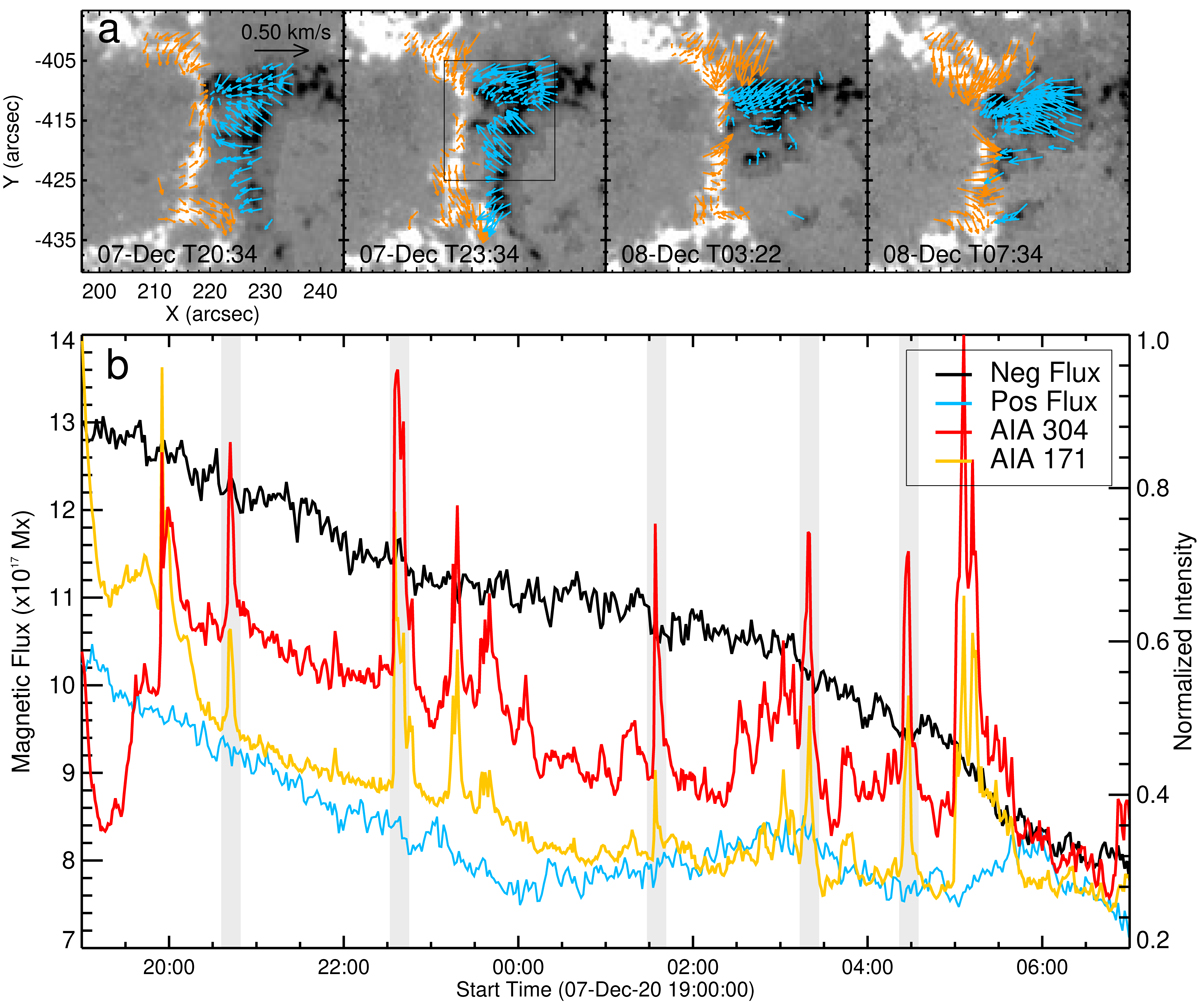
Evolution of the magnetic fileds. Panel a: HMI LOS magnetograms superimposed over the velocity fields. The blue (orange) arrows represent the velocity of the negative (positive) polarities. Panel b: temporal evolution of integrated magnetic fluxes and normalized 304 Å and 171 Å intensities. The black box shows the region for integrating magnetic fluxes. The shadowed regions correspond to the time periods of bursts shown in Fig. 5.
Current usage metrics show cumulative count of Article Views (full-text article views including HTML views, PDF and ePub downloads, according to the available data) and Abstracts Views on Vision4Press platform.
Data correspond to usage on the plateform after 2015. The current usage metrics is available 48-96 hours after online publication and is updated daily on week days.
Initial download of the metrics may take a while.