Fig. 5.
Download original image
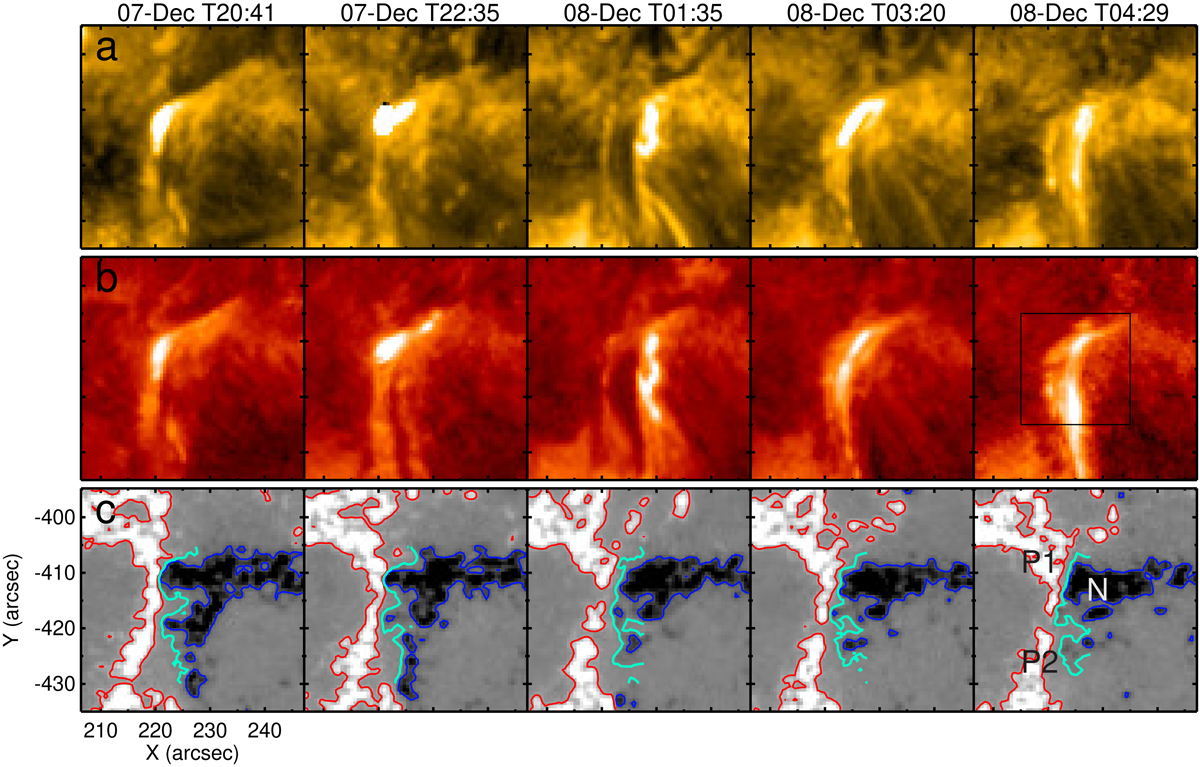
Intermittent brightenings observed by the AIA. Panels a and b: time-sequence of AIA 171 Å and 304 Å images displaying repeatedly occurred EUV bursts at the site of the flux cancelation. The black box shows the region for integrating the intensity. Panel c: HMI LOS magnetograms with red/blue contours representing the positive/negative magnetic fields of ±100 G. The cyan line represents the PIL, and P1 (P2) and N represent the positive and negative polarities, respectively.
Current usage metrics show cumulative count of Article Views (full-text article views including HTML views, PDF and ePub downloads, according to the available data) and Abstracts Views on Vision4Press platform.
Data correspond to usage on the plateform after 2015. The current usage metrics is available 48-96 hours after online publication and is updated daily on week days.
Initial download of the metrics may take a while.