Free Access
Fig. 4.
Download original image
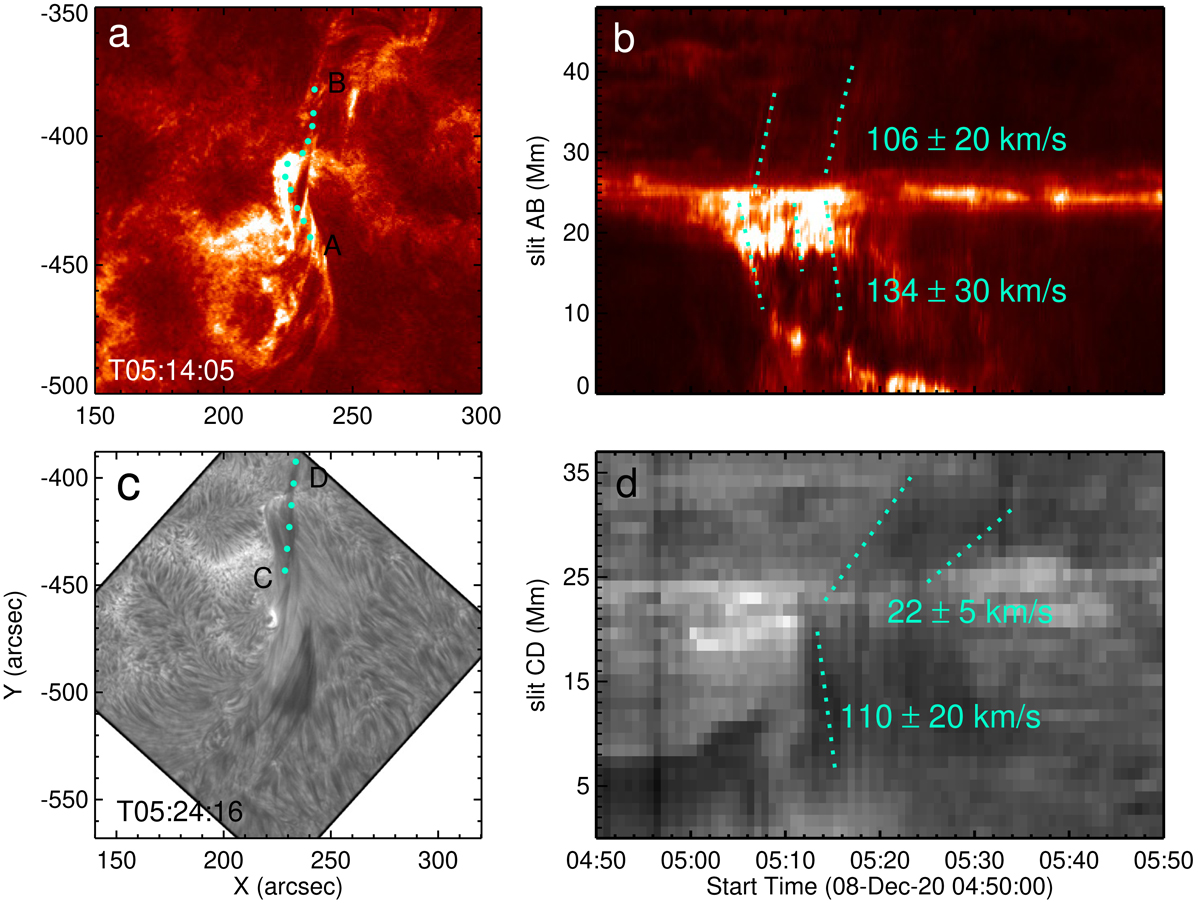
Time–distance diagrams showing the outflow jets. Panels a and c: AIA 304 Å and NVST Hα images. The curved slits AB and CD, as shown by two dotted lines, represent the directions of the reconnection outflows. Panels b and d: 304 Å and Hα slice-time plots. The inclined dotted lines show the trajectories of outflow jets.
Current usage metrics show cumulative count of Article Views (full-text article views including HTML views, PDF and ePub downloads, according to the available data) and Abstracts Views on Vision4Press platform.
Data correspond to usage on the plateform after 2015. The current usage metrics is available 48-96 hours after online publication and is updated daily on week days.
Initial download of the metrics may take a while.