| Issue |
A&A
Volume 663, July 2022
|
|
|---|---|---|
| Article Number | A116 | |
| Number of page(s) | 16 | |
| Section | Interstellar and circumstellar matter | |
| DOI | https://doi.org/10.1051/0004-6361/202142980 | |
| Published online | 22 July 2022 | |
Pulsar scintillation studies with LOFAR
I. The census
1
Fakultät für Physik, Universität Bielefeld,
Postfach 100131,
33501
Bielefeld, Germany
e-mail: This email address is being protected from spambots. You need JavaScript enabled to view it.
2
Max-Planck-Institut für Radioastronomie,
Auf dem Hügel 69,
53121
Bonn, Germany
3
LPC2E – Université d’Orléans/CNRS,
45071
Orléans Cedex 2,
France
4
Station de Radioastronomie de Nançay, Observatoire de Paris – CNRS/INSU,
USR 704 – Univ. Orléans, OSUC, Route de Souesmes,
18330
Nançay, France
5
Manly Astrophysics,
15/41–42 East Esplanade,
Manly,
NSW 2095, Australia
6
ASTRON, the Netherlands Institute for Radio Astronomy,
Oude Hoogeveensedijk 4,
Dwingeloo
7991 PD, The Netherlands
7
SKA Observatory, Jodrell Bank, Lower Withington,
Macclesfield
SK11 9FT, UK
8
Department of Physics and Astronomy, University of the Western Cape,
Bellville,
Cape Town
7535, South Africa
9
Hamburger Sternwarte, University of Hamburg,
Gojenbergsweg 112,
21029
Hamburg, Germany
10
Leibniz-Institut für Astrophysik Potsdam (AIP),
An der Sternwarte 16,
14482
Potsdam, Germany
Received:
22
December
2021
Accepted:
18
March
2022
Abstract
Context. Interstellar scintillation (ISS) of pulsar emission can be used both as a probe of the ionized interstellar medium (IISM) and cause corruptions in pulsar timing experiments. Of particular interest are so-called scintillation arcs which can be used to measure time-variable interstellar scattering delays directly, potentially allowing high-precision improvements to timing precision.
Aims. The primary aim of this study is to carry out the first sizeable and self-consistent census of diffractive pulsar scintillation and scintillation-arc detectability at low frequencies, as a primer for larger-scale IISM studies and pulsar-timing related propagation studies with the LOw-Frequency ARray (LOFAR) High Band Antennae (HBA).
Methods. We use observations from five international LOFAR stations and the LOFAR core in the Netherlands. We analyze the 2D auto-covariance function of the dynamic spectra of these observations to determine the characteristic bandwidth and timescale of the ISS toward the pulsars in our sample and investigate the 2D power spectra of the dynamic spectra to determine the presence of scintillation arcs.
Results. In this initial set of 31 sources, 15 allow for the full determination of the scintillation properties; nine of these show detectable scintillation arcs at 120–180 MHz. Eight of the observed sources show unresolved scintillation; and the final eight do not display diffractive scintillation. Some correlation between scintillation detectability and pulsar brightness and a dispersion measure is apparent, although no clear cut-off values can be determined. Our measurements across a large fractional bandwidth allow a meaningful test of the frequency scaling of scintillation parameters, uncorrupted by influences from refractive scintillation variations.
Conclusions. Our results indicate the powerful advantage and great potential of ISS studies at low frequencies and the complex dependence of scintillation detectability on parameters such as pulsar brightness and interstellar dispersion. This work provides the first installment of a larger-scale census and longer-term monitoring of ISS effects at low frequencies.
Key words: pulsars: general / ISM: clouds
© ESO 2022
1 Introduction
Radio pulsars are neutron stars that emit beams of radio waves from their magnetic poles. Due to the small size of these stars and the even smaller size of their emission regions, pulsars are detectable as point sources. The compact beams of radiation emitted from the pulsar’s magnetic poles are constantly perturbed by a refractive index fluctuation in the ionized interstellar medium (IISM), generating random phase variations in the various rays of light. The interference between these essentially uncorrelated scattered rays results in a modulation of the pulse intensity as a function of frequency and time, which is well-known as interstellar scintillation (ISS, Scheuer 1968). The two main types of ISS are diffractive ISS (DISS, Rickett 1969), caused by small-spatial-scale density fluctuations (106−108 m), and refractive ISS (RISS, Sieber 1982; Rickett et al. 1984), resulting from large-spatial-scale density inho-mogeneities (1010−1012 m) in the IISM. These types become distinct in the strong scattering regime (multipath propagation), where numerous scattered rays interfere with one another to form an interference pattern on the observer plane (Rickett 1990; Narayan 1992). However, the origin of ISS is still under debate and some alternative models based on discrete plasma structures have been proposed recently (Romani et al. 1987; Pen & Levin 2014; Gwinn 2019).
Scintles, that is enhanced pulse intensity variations with relatively short timescales and narrow frequency bandwidths, are identified in dynamic spectra, which are a two-dimensional (2D) matrix of pulsed intensity as a function of time (t) and frequency (v). With diffractive ISS parameters obtained from dynamic spectra, one can do the following: study the turbulence in the IISM (Cordes et al. 1985; Spangler & Gwinn 1990) and the local bubble (Bhat et al. 1998); constrain the pulsar proper motion (Cordes 1986; Gupta 1995); study properties of binary systems (Coles et al. 2005; Rickett et al. 2014) and modulations on DISS from RISS (Bhat et al. 1999c); model the IISM based on annual variations of scintillation (Reardon et al. 2019); among other things.
Two decades ago, scintillation arcs were identified in the so-called secondary spectra, which are the 2D power spectra of dynamic spectra (Stinebring et al. 2001). These scintillation arcs probe the IISM structure and frequently show up as “criss-cross” sloping bands in dynamic spectra, resulting from interference between rays in a central core and scattered rays from an extended scattering disk (Walker et al. 2004; Cordes et al. 2006). The past decade and a half have shown increasing interest and applications of these arcs; readers can refer to (Trang & Rickett 2007), (Walker et al. 2008), (Brisken et al. 2010), (Pen & Levin 2014), (Main et al. 2020), (Reardon et al. 2020), and (Yao et al. 2021), for example, for more details.
High-precision pulsar timing experiments, such as pulsar timing arrays (PTAs), are a promising method of detecting and characterizing low-frequency gravitational waves (see, e.g., Verbiest et al. 2021, and references therein). PTA experiments currently rely on stable millisecond pulsars with a low dispersion measure (DM1 < 50pccm−3) at high frequencies (mostly at 1.4GHz) to minimize propagation effects on pulsar timing precision (Lam et al. 2017). The two branches of propagation effects that could affect the pulsar timing precision are dispersion and scattering (Verbiest & Shaifullah 2018). Dispersion is well studied and its effect on pulsar timing can, in principle, be measured precisely and eliminated completely (Donner et al. 2020); although, readers can refer to (Cordes et al. 2016) for a complicating factor. Scintillation and the related pulse broadening (Cordes & Rickett 1998), however, are not corrected as easily (Lentati et al. 2017). Moreover, at high observing frequencies, nearby pulsars could be in the weak scintillation regime, resulting in a small number of scintles in the dynamic spectrum and with relatively small pulse broadening delays. A possible way to mitigate the propagation effects on PTA data at high frequencies could be through low-frequency monitoring of these pulsars, so as to determine corrections for the high-frequency data. The scattering time delays could then potentially be measured directly from the power distribution in the secondary spectrum (Hemberger & Stinebring 2008; Main et al. 2020) or through holographic techniques (Walker et al. 2008, 2013; Pen et al. 2014; Demorest 2011), which may lead to significant improvements in timing precision.
In this work, we present the first census of scintillating pulsars with the LOw Frequency ARray (LOFAR). This work has been organized in the following manner: in Sect. 2 we describe our observations and data processing; in Sect. 3 we show the analysis and results; and Sect. 4 contains our conclusions.
Properties of the observations and scintillation characteristics for the 15 pulsars with detectable scintillation.
2 Observations and Data Processing
2.1 Observations
Our analysis is based on observations in the frequency range 120–180MHz, taken in stand-alone mode with five international LOFAR stations (van Haarlem et al. 2013), namely those in Effelsberg (DE601), Tautenburg (DE603), Potsdam-Bornim (DE604), Norderstedt (DE609), and Nançay (FR606), as well as the LOFAR core (see Table 1 for details). Our processing pipeline was based on the dspsr (van Straten & Bailes 2011) package with frequency and time resolution tuned depending on the scintle size. Subsequently, observations were written out in the psrfits format (Hotan et al. 2004) and processed with psrchive (van Straten et al. 2012).
2.2 Source Selection
The pulsars included in this work were selected primarily based on their dispersion measure, and on their brightness in the LOFAR HBA band, as given by (Kondratiev et al. 2016), (Bilous et al. 2016), (Sanidas et al. 2019), or (Xue et al. 2017), or based on extrapolations from higher frequencies. According to the thin-screen theory, the scintillation bandwidth is expected to scale as Δvd ∝ DM−2.2v4.4 (e.g., Romani et al. 1986), so that large values for the DM would result in unresolvably small scintles at our low frequencies. Consequently, we only considered pulsars in the LOFAR sky (declination above −20°) with a DM below 50 pc cm−3 and with a flux density at 150 MHz above 10 mJy. To evaluate the flux density, we either used published flux densities at 150 MHz directly, or we extrapolated from higher frequencies based on the known spectral index of the pulsar in question or based on a spectral index of −1.4, which is slightly shallower than the expected average spectral index of radio pulsars (Bates et al. 2013; Jankowski et al. 2018) and hence it provides a slightly conservative estimate of the flux density at 150 MHz. Pulsars that were given as nondetections by either (Kondratiev et al. 2016) or (Bilous et al. 2016) were excluded. All pulsars that satisfy the declination and DM requirements and for which an estimate of the flux density could be obtained, are shown in Fig. 1. The brightness of the pulsar affects the following two things: first, the ability to detect scintillation arcs because only a small fraction of the emitted power will be seen spread out to the arcs and, second, the ability to detect scintles since the high resolution required for scintillation studies at these frequencies implies the signal-to-noise ratio (S/N) threshold for detection must be achievable during very short durations and across very narrow channels. However, since no previous, clearly defined census of scintillation was carried out, particularly at low frequencies, no clear cut-off value for the flux density can be defined. Consequently in the selection of this initial installment of the census, we concentrated on bright pulsars, while also including some fainter sources that appeared promising, based on scintillation studies at higher frequencies.
2.3 Data Processing
2.3.1 Radio-Frequency Interference (RFI)
The RFI cleaning program iterative_cleaner2 is a modification of the surgical method included in the RFI cleaner of the coastguard pulsar-data analysis package (Lazarus et al. 2016). Two major changes were made: first, the ITER-ATIVE_CLEANER uses an iterative approach to determine the RFI-free template profile, which is particularly useful when the RFI is more powerful than the pulsar signal. Second, the (simple) de-trending algorithm for correcting gradual changes in both time and frequency was removed.
2.3.2 Scintillation Parameters
After polarization averaging to total intensity using the pam program of the psrchive package, we created the initial dynamic spectrum with the DYNAMIC_SPECTRA or psrflux programs (also from the psrchive package). Trends in the frequency direction as a result of the instrumental bandpass and the spectral index of the pulsar were then removed from the dynamic spectrum by fitting a power-law function to a time-averaged version of the dynamic spectrum. In order to minimize the impact of temporal variations on the dynamic spectrum, we subtracted the mean of each subintegration. This approach was previously introduced by (Reardon et al. 2019).
Using the dynamic spectrum, one can estimate the diffrac-tive scintillation bandwidth Δvd and the diffractive scintillation timescale τd by computing a 2D autocovariance function (ACF) of the dynamic spectrum. To calculate the 2D ACF, we first padded the finite dynamic spectrum with an equal length of zeroes in the frequency and time dimensions, then we performed a 2D fast Fourier transform (FFT), took the squared magnitude of the result, and performed an inverse 2D FFT, following (Reardon et al. 2019). Since the center of the 2D ACF is often visible as a noise bridge, it was replaced by the mean value of nearby pixels. Finally the 2D ACF was peak-normalized.
Next, we determined the scintillation bandwidth and timescale by fitting a Gaussian and an exponential function to one-dimensional (1D) cuts through the 2D ACF along the X and Y axes (v = 0 and τ = 0, respectively). This approach ignores any tilts in the ACF, but suffices as a first-pass analysis of the ISS properties along our lines of sight to pulsars. The analysis of tilts in our ACFs is deferred to a future paper. The functions fitted are a slight modification to the previous standard of a Gaussian function (Cordes & Rickett 1998) and are as follows
 (1)
(1)
and the resulting scintillation parameters are defined as the following (similar to Bhat et al. 1999b):
 (2)
(2)
The uncertainties of the individual points in the 1D ACF slices are given by Eq. (1) of (Bhat et al. 1999b). Due to the limited time and frequency resolution of our dynamic spectra, the scintles appear bigger than they really are. This effect in both of these parameters can be corrected for by subtracting the resolution from the parameters quadratically, as described by (Bhat et al. 1999b):
 (3)
(3)
where Δf and Δt are the frequency and time resolution (listed in Table 1), respectively. The uncertainty of the scintillation parameters consists of the quadrature sum of the uncertainty coming from the fitting procedure and the statistical error σest due to the finite number of scintles (Bhat et al. 1999b):
 (4)
(4)
Here, BWdyn and Tdyn are the observing bandwidth and length, respectively, and fd ( = 0.4) is the filling factor. For PSR J0953+0755, σest is about 17%. In contrast, for all other pulsars in our sample, σest is typically smaller than 1% in the LOFAR frequency range, even in 10-MHz-wide sub-bands (see Sect. 3).
To compute the secondary spectra, following (Reardon et al. 2020), we applied a Hamming window function to the outer 10% of each dynamic spectrum to reduce the effects of aliasing in the secondary spectrum. After this, we formed the secondary spectrum using a 2D discrete Fourier transform, taking its squared magnitude, shifting it, and then converting the relative power levels into a decibel scale. The program parabfit described in (Bhat et al. 2016) was used to measure the arc curvature based on a Hough transform. Fundamentally, parabfit sums the power over a given parabolic region in the secondary spectrum. It also optimizes the width of the parabolae, which is parametrized by the pdist parameter, and opening angle, which is parameterized by the curves parameter, in order to achieve a maximum of summed power.
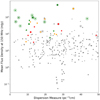 |
Fig. 1 Source sample selection. All pulsars with a DM lower than 50 pc cm−3 are shown. The star symbols represent pulsars with a published flux density at 150 MHz. The dot markers represent the pulsars for which no published flux density at 150 MHz exists; in these cases, the flux densities were extrapolated from higher frequencies, using a conservative spectral index of −1.4, unless a spectral-index measurement was previously published. The green symbols represent pulsars for which we detected scintillation in our LOFAR data, while red symbols represent pulsars for which scintillation was not detectable. Orange symbols indicate sources for which the scintillation was detected but not resolved (see text). Sources for which scintillation arcs were published in literature are encircled with a gray circle, while scintillation arcs presented in this work are represented by green circles. |
Observational data for pulsars for which the scintillation bandwidth Δνd could not be successfully derived.
3 Analysis and Results
From the 31 pulsars that were studied in this work, 15 showed clear scintillation at LOFAR frequencies (see Table 1, Figs. 2 and 3), while 15 either did not show evidence for scintillation at all, or they did show scintillation but with an insufficient S/N to allow a reliable quantification (see Table 2). We note that nonde-tections can be expected for two reasons, as illustrated in Fig. 4. In most cases, our frequency resolution did not suffice to resolve the scintles and hence did not allow for detailed measurements of the scintillation bandwidth, as in the case of the observation of PSR J1509+5531. While, in principle, this could be remedied by using higher frequency resolution, this is limited by available processing resources by the amount of time resolution that is needed to resolve the pulse profile (particularly in the case of rapidly spinning MSPs) and by the S/N one can achieve in an extremely narrow bandwidth. In the case of PSR J1012+5307, for example, the scintles appear to be resolved; however, even with the full sensitivity of the LOFAR core, they only barely stand out above the noise3.
Representative dynamic spectra for the 15 pulsars with detected scintles are shown in Fig. 2. Clear criss-cross structures indicative of scintillation arcs can be seen, for example, for PSRs J0826+2637, J1136+1551, and J1932+1059, and a few more arcs can be seen in the secondary spectra (see Fig. 3). Although, they are hard to study at these frequencies in many cases due to the fact that they tend to lie close to the delay axis and because they are far less sharp than at higher frequencies (Rickett et al. 2021). Nevertheless, several of these arcs are sufficiently clearly detected to allow detailed studies, even at these frequencies.
Two of the pulsars (PSRs J0034−0721 and J2022+5154) in our sample display pulse-nulling behavior (see Fig. 5), which can be seen as a vertical structure in Fig. 2, which could be removed by applying a Wiener filter to the dynamic spectrum, as described by (Lin et al. 2021). However, this is beyond the scope of the present paper. While this nulling prevents the accurate determination of τd, we can still determine Δvd without a problem. Nevertheless, the uncertainty determination for Δvd is problematic since the statistical error σest given in Eq. (4) contains an unreliable measurement of τd from these two nulling pulsars. We note that the BWdyn/Δvd term plays a major role in deriving the statistical error σest.
From our measured scintillation parameters, some further measures can be derived to describe the IISM, as discussed in detail by (Rickett 1990). Specifically, the ratio of the Fresnel scale and the DISS scale4 sd quantifies the scattering strength u (Rickett 1990; Bhat et al. 1999b):
 (5)
(5)
The observed values of u from 15 pulsars are given in column 10 of Table 1, showing that all our observations are clearly in the strong scattering regime (u > 1). Within this regime, we can estimate the timescale of refractive scintillation (RISS), using (Rickett 1990) and (Wang et al. 2005):
 (6)
(6)
The derived values of tr are shown in Col. 11 of Table 1 for LOFAR frequencies; under the assumption of a Kolmogorov turbulence spectrum, these scale as tr ∝ v−22 with the observing frequency. Given that our observation lengths are orders of magnitudes smaller than tr for all pulsars in our sample, we can be confident our DISS measurements are uncorrupted by RISS effects. It is important to note, however, that τd is strongly affected by the relative motion of the Earth and the pulsar and can hence affect tr significantly throughout the year, especially for pulsars with relatively small transverse velocities. Since our analysis is based on single-epoch observations, our results remain unaffected by this.
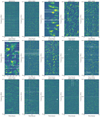 |
Fig. 2 Dynamic spectra of 15 scintillating pulsars with LOFAR. The white patches were removed because of radio-frequency interference. The color scheme indicates the pulse S/N ranging from blue |


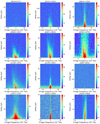 |
Fig. 3 Secondary spectra of 15 scintillating pulsars detected with LOFAR in the frequency range 145–155MHz (except for PSR J0814+7429: 125 ± 5 MHz; PSR J0953+0755: 150 ± 20 MHz; and PSR J2018+2839: 175 ± 5 MHz). The black parabolae are the resulting model fits with parameters given in Table 3. |
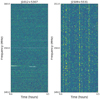 |
Fig. 4 Dynamic spectra of PSRs J1012+5307 and J1509+5531 from the LOFAR core and DE602, respectively, illustrating the challenges inherent to scintillation detection at low frequencies. While scintillation is clearly visible in the PSR J1509+5531 data, higher frequency resolution is required to allow for the accurate determination of the scintillation parameters. For PSR J1012+5307, the resolution is sufficient, but the remaining S/N for individual scintles is insufficient to allow for a clear analysis. While the dynamic spectrum does combine data from all scintles across the observation, it still returns a S/N that is too low for reliable measurements in this case. |
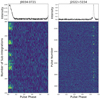 |
Fig. 5 Nulling behavior of pulsars in our sample. PSRs J0034−0721 and J2022+5154 show nulling behavior as shown above. The top row shows the integrated profile of a 1-h observation with FR606 across the frequency range 125–150MHz for PSR J0034−0721 (left) and of a half-hour observation with the LOFAR core across the frequency range 149–153 MHz. The intensity-phase plots of these data are shown in the bottom row as a function of the integration number for the PSR J0034−0721 data, which have a 10-s subintegration length, and as a function of the pulse number for the single-pulse data on PSR J2022+5154. The intermittent character of their emission makes the determination of the scintillation timescale complicated, but the scintillation bandwidth can still be determined using standard methods. |
3.1 Turbulence Characteristics of the IISM
Between the inner and outer scales of turbulence (the so-called inertial subrange scales, Zhou & Speziale 1998), electron-density fluctuations follow the well-known Kolmogorov spectrum (Armstrong et al. 1995). The inner scale is constrained to ~100 km (Spangler & Gwinn 1990; Rickett et al. 2009) and the outer scale is on the order of -100pc (Armstrong et al. 1995; Xu & Zhang 2017) or 1-20 pc (Rickett et al. 2009). It is also increasingly clear that the underlying scattering structures are often anisotropic (Brisken et al. 2010; Walker et al. 2009; Stinebring et al. 2019).
Our data allow for a meaningful test of the turbulent spectrum of the IISM since at these low frequencies, even a narrow frequency range can enable one to obtain numerous scintles (see Fig. 2), permitting a self-consistent instantaneous test of the frequency-scaling laws in the turbulent medium. Specifically, Δvd is predicted to scale with the observing frequency as Δνd ∝ v−α, where the power-law index α = 4.4 for a Kolmogorov turbulence spectrum and α = 4.0 for Gaussian turbulence. An alternative method to determine α is by measuring the scatter broadening, as was done by (Bansal et al. 2019), (Krishnakumar et al. 2019) and (Geyer et al. 2017), for example.
Determination of α. In this work, we report independent measurements of α from our LOFAR data set. We obtained Δvd from dynamic spectra of 10-MHz-wide frequency bands for each pulsar, except for PSR J0953+0755, in which case we adopted a 20-MHz-wide band in order to increase the number of scintles and thus reduce the statistical uncertainty. Then, based on the measurements of Δvd (v) (obtained from a single observation), we were able to get the parameter α without any influence from RISS. The measurements of Δνd for the 15 nearby pulsars in our sample are given along with any previously published measurements of Δvd in Appendix A and they are shown in Fig. 6. The derived values for α are listed in Table 1. The large uncertainty of Δνd for PSR J2022+5154 is due to an insufficient S/N which makes the 2D ACF ill-defined, preventing a measurement of α.
Comparison with theory. The measured α values are mostly consistent with the predictions for both a Kolmogorov and a Gaussian spectrum, except for PSRs J1239+2453 (α = 3.21 ± 0.29) and J2022+2854 (α = 6.56 ± 0.24), which are too shallow and too steep, respectively. For convenience, the gray dashed lines that represent the prediction for α = 4.4 are also presented for these two pulsars in Fig. 6. For PSR J2022+2854, the Kolmogorov spectrum does match previously published values of vd across a wider frequency range, even if within our LOFAR band a much steeper gradient is observed. In the case of PSR J1239+2453, previously published values for νd are scattered and do not seem to prefer either the Kolmogorov gradient or the shallower spectrum derived from our LOFAR data.
A flatter α may be due to associations with Hii regions, spiral arms, or supernova remnants (Goodman & Narayan 1985); finite and anisotropic scattering screens (Cordes & Lazio 2001; Geyer et al. 2017); or the fact that the diffraction scale sd becomes smaller than the inner scale at lower frequencies (e.g., Bansal et al. 2019). It has also been suggested (Xu & Zhang 2017) that a composite electron-density spectrum could cause shallower values of α for high-DM pulsars.
For PSR J1239+2453, sd ~ 1/(kθd) ~31000 km which is larger than the inner scale, where θd is the width of the angular scattering given by  mas in which Dp = 0.85 ± 0.06 kpc (Brisken et al. 2002) and k is the wave number, following (Rickett 1990). Consequently, the inner scale cannot be the cause for the shallow spectrum we observed. Furthermore, the suggestion of (Xu & Zhang 2017) is not relevant to this pulsar since it lies above the Galactic plane (Gb = 86.5°) and has a small DM of 9.25pccm−3. Significant anisotropy in the scattering medium may well provide an explanation for the shallow spectrum as the power-law indices of pulsars with scintillation arcs have been observed to be shallower (Stinebring et al. 2019) and these arcs are caused by anisotropies. For PSR J1239+2453, this could be a possible explanation since arcs have recently been detected at higher frequencies (Fadeev et al. 2018), even if they are undetectable in our LOFAR data.
For PSR J2022+2854, the steep α could be because of scattering from large-scale inhomogeneities involved, which may suggest that the effect of refractive scattering is large and is independent of the observing frequency and the pulsar distance (Goodman & Narayan 1985). This requires further investigation of RISS and is deferred to a future paper.
Comparison with literature. The α for PSRs J0332+5434, J2018+2839, and J2219+4754 agree with the values reported by (Krishnakumar et al. 2017, 2019), and (Bansal et al. 2019). However, our α measurement of PSR J0826+2637 (4.1 ± 0.2) strongly differs with those in the literature: 1.55 ± 0.09 (Bansal et al. 2019) and 2.4 ± 0.1 (Krishnakumar et al. 2019). This could result from the frequency-dependent evolution of α (Spangler & Gwinn 1990) and will be investigated in detail in the second paper in this series. For the remaining pulsars in our sample, no previous estimates of a have been published to date, which is partly expected since the pulse scatter broadening becomes unresolvably small, particularly at higher frequencies. In this regard, the recent Nen-uFAR upgrade to the LOFAR station at the Nancay observatory has great potential to complement our work (Bondonneau et al. 2021).
With α, we are able to predict the scintillation bandwidth at other frequencies (see Fig. 6 and Appendix A). The Δvd values from literature are typically consistent with our predictions, although some discrepancies exist. Specifically, there are significant differences for PSRs J0837+0610, J1607−0032, and J1921+2153. The previously published measurements of the scintillation bandwidth for these three sources span a wide range from ~ 100 MHz to 1 GHz. While even for these three pulsars, most previously published values are consistent with our predictions; in particular, across the 300–500 MHz range, there are some significant discrepancies. Below, we discuss the potential causes of these discrepancies.
Modulation by RISS. (Bhat et al. 1999a) presented long-term scintillation observations of 18 pulsars, whereby the variation of Δvd was clearly detected for all pulsars, but it could only be explained in terms of RISS for two pulsars in their sample. However, traditional scintillation theory is based on an infinite and isotropic scattering screen, whereas presently it is well established that highly anisotropic scattering screens are common (Stinebring et al. 2001; Brisken et al. 2010). This implies that more extreme Δvd variations than predicted from standard theory may still be caused by RISS, although the possible amplitude of such variations is ill-defined.
Limited bandwidth and observing length. The limited window of measured dynamic spectra can cause large differences due to the small number of scintles, particularly at high observing frequencies for low DM pulsars. A clear discussion of this was recently published by (Bilous et al. 2022).
Short-lived discrete ionized clouds. During the epochs arclets existed, the scintillation bandwidth Δvd always exhibited considerably smaller values, for example 4.0 ± 0.5 kHz at 324 MHz and ~3 kHz at 327 MHz for PSR J0837+0610, as reported by (Smirnova et al. 2020) and (Brisken et al. 2010). It is important to note that we predict a value of ~325 kHz for Δvd at those frequencies. The observable arclets imply that in addition to the central screen, discrete clumps contribute to scattering as well (Cordes et al. 2006), which equivalently means a high scattering angle is involved, corresponding to a smaller scintillation bandwidth Δvd. We anticipate the detection of a variation in scintillation bandwidth Δvd as such discrete clouds pass the line of sight.
Overall variability in the IISM. In addition to extreme events such as those proposed by (Smirnova et al. 2020), more gradual changes in the IISM along the line of sight could cause evolution of scintillation parameters on longer timescales, leading to differences between values that are published many years apart. (Bansal et al. 2019) and (Bhat et al. 1999a) studied the temporal evolution of scintillation parameters on timescales of years and showed that while such secular variations do occur along some lines of sight, in most cases they are either absent or very shallow.
Nonastronomical causes. There are other possible reasons for this, such as RFI, instrumental failures, general instrumental limitations, or potential errors in the procedures applied in obtaining the scintillation parameters.
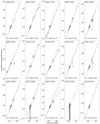 |
Fig. 6 Scintillation bandwidth versus the observing frequency in log-log scale. Filled symbols designate our LOFAR measurements presented in this paper, and open symbols are previously published values collated from literature and given (with references) in the table in Appendix A. The black dashed lines with a slope of α show the best fit to the Δvd values across our LOFAR observing band. The gray dashed line corresponds to the Kolmogorov spectrum with α = 4.4, which is only plotted in case the best-fit line is inconsistent with the Kolmogorov spectrum. |
3.2 Scintillation Arcs
Scintillation arcs are well-described with the thin-screen approximation (Walker et al. 2004; Cordes et al. 2006). The interfering unscattered rays at the piercing point of the direct line of sight toward the pulsar and scattered rays an angle θ away from the piercing point display a differential geometric time delay τ and differential Doppler shift fD, which causes the interference to be well-described as a parabola with curvature η in the secondary spectrum, since τ and fD relate as follows:
 (7)
(7)
where the arc curvature η can be shown to be defined as follows:
 (8)
(8)
Here, Veff is the effective transverse line-of-sight velocity vector at the scattering screen; c is the speed of light; v is the observing frequency; s is the fractional distance of the scattering screen, where s = 0 is a screen at the pulsar’s location and s = 1 is a screen at the Earth’s position; Dp is the distance between the pulsar and Earth; and ψ is the angle between the (1D) scattering structure and Veff (Cordes et al. 2006; Yao et al. 2020).
For solitary pulsars, the effective transverse line-of-sight velocity Veff contains three components: the pulsar’s transverse velocity Vp, the earth motion VE, and the movement of scattering material VISM, which were combined as follows (Reardon et al. 2019):
 (9)
(9)
In this work we ignore VISM. We also assume ψ to be 0, which in practice means that we placed a lower limit on the screen distance.
3.2.1 The Distance of the Scattering Screens
For nine of our pulsars, scintillation arcs can be detected at LOFAR frequencies (see Fig. 3). Due to the v−2 dependence in the arc curvature, scintillation arcs at LOFAR frequencies have a significantly larger curvature and they are more diffuse (Rickett et al. 2021), which complicates their analysis. Arc asymmetries, which can provide information on the interplay of dispersion, refraction, and phase gradients in the IISM (Coles et al. 2010), can however be readily quantified.
With Eq. (8), we were able to estimate the screen distance based on the arc curvature η given in Table 3. However, here we clarify that the method that we describe above has several assumptions in it, namely that the screen is isotropic, or that the pulsar velocity is aligned with the screen axis (ψ = 0) and that the screen has no velocity. The influence on a distance determination coming from VISM may be negligible since the screen velocity usually has a small value of ~10km s−1 compared to the transverse velocity of the pulsar for most pulsars; although, we note that the screen velocity has in some cases been reported to reach (or even exceed) 50km s−1 (Ord et al. 2002; Reardon et al. 2020). The unknown parameter cos ψ varying between 0 to 1 could result in a huge discrepancy if the anisotropic screen dominates the scattering. To resolve cos ψ and VISM, periodic variations in the scintillation timescale or arc curvature, or the measure of inter-station time delays is needed (Reardon et al. 2019, 2020; Main et al. 2020; Brisken et al. 2010). In conclusion, under the assumptions above, the distance obtained in this work is a lower limit on the screen distance from Earth if the screen is misaligned with the pulsar velocity.
PSR J0814+7429: (Rickett et al. 2000) studied the properties of the scattering medium based on long-term weak scintillation monitoring. They proposed that scattering is caused by a uniformly extended medium distributed along the entire line of sight or located in the range 170–220 pc from Earth, based on a pulsar distance of 310 pc (Taylor & Cordes 1993). Since the actual distance to this pulsar has since been revised to 433 pc (Brisken et al. 2002), we recomputed the screen distances as determined by (Rickett et al. 2000), which returned a screen in the range 275–355pc. In addition, (Bhat et al. 1998) expected the enhanced scattering to be located at 72 ± 13 pc from Earth. We report, for the first time, a high degree of asymmetry in the arc of this pulsar. The measured η infers a lower limit of  pc on the distance of the enhanced scattering material from Earth, consistent with the distanced-revised screen distance from (Rickett et al. 2000).
PSR J0826+2637: This pulsar has been shown to have four arcs (Putney & Stinebring 2006) at some times and a single arc (e.g., Stinebring et al. 2001) at other times. The arc we observed has  pc and is consistent with the “c” arc reported by (Putney & Stinebring 2006) and the single arc with the location 240 ± 90 pc reported by (Fadeev et al. 2018).
PSR J0837+0610: Clear arclets and a 1-ms isolated feature were detected and analyzed by (Brisken et al. 2010). They also reported that the screen is located at 420 pc from Earth which is consistent with 460 ± 80 pc (Hill et al. 2005), 420 ± 90 pc (Fadeev et al. 2018), and 410 ± 40 pc (Smirnova et al. 2020) reported earlier. Our result, however, is  pc from Earth, which is only marginally consistent with the other published results.
PSR J0953+0755: (Smirnova et al. 2014) propose two enhanced layers along the line of sight, at distances of 4.4–16.4pc and 26–170pc, to interpret their observations. We first report an asymmetric arc. From our arc curvature, we derived  pc.
pc.
PSR J1136+1551: This pulsar has been detected with four arcs (Hill et al. 2003; Putney & Stinebring 2006) and a single arc (Stinebring et al. 2019) at different times. It was also found that a 1D brightness distribution is in good agreement with the observed features at multiple frequencies with a screen placement of ≥136pc from Earth (Stinebring et al. 2019). This is consistent with our measurement of  pc.
pc.
PSR J1921+2153: (Shishov et al. 2017) observed diffractive scintillation which they suggest could come from inhomo-geneities in a thin-screen turbulent plasma at a distance of 440 pc from the observer, based on a pulsar distance of1 kpc from Cordes & Lazio 2002; or from homogeneously distributed scattering material between Earth and the pulsar. In rescaling their screen distance by using the pulsar distance of 810 pc derived from the YMW electron-density model (Yao et al. 2017), their screen distance becomes 360pc. This is still in disagreement with our value of  pc, which we derived from the detection of scintillation arcs for this source.
PSR J1932+1059: This pulsar has been observed with three arcs (Putney & Stinebring 2006) and a single arc (Fadeev et al. 2018; Yao et al. 2020) at different epochs. The placement of the screen has been determined as 200 ± 20 pc (Yao et al. 2020) and 190 ± 50 pc (Fadeev et al. 2018), which is consistent with our result of  pc.
pc.
PSR J2018+2839: (Fadeev et al. 2018) propose two possible solutions for the distance to this pulsar’s scattering screen, namely 100 pc or 550 ± 30 pc, depending on the analysis method used. We found that the scattering screen is likely located at either 390 ± 45 pc or 500 ± 30 pc; there are two solutions for the measured arc curvature of PSR J2018+2839. The latter of these two solutions is highly consistent with the distance (Fadeev et al. 2018) derived from the scattering time τsc and with the angular size of the scattering disk as measured by (Britton et al. 1998).
PSR J2219+4754: This pulsar has a highly variable IISM along its line of sight (Ahuja et al. 2005; Michilli et al. 2018) and is the first pulsar with a clear detection of frequency-dependent, time-variable DM (Donner et al. 2019). The arc curvature of this pulsar at 150MHz is 50.1 ± 8.5 s−3. However, this curvature does not allow a real distance to be determined since the determinant of Eq. (8) becomes negative.
Here, we summarize the properties of the arcs we detected in the LOFAR data. Firstly, most scintillating pulsars can be seen with an arc in our census (9/15), which suggests that arcs could be a common phenomenon. Moreover, the highly asymmetry arcs indicate the presence of DM gradients, which should be detectable through monitoring studies (Coles et al. 2010). Secondly, for a particular pulsar, the number of observable scintillation arcs varies with time and observing frequency, likely as a consequence of the strong variability of the IISM structures involved or the line of sight’s rapid motion through these structures. Furthermore, the diffuse nature of arcs at low frequencies make identification of multiple arcs extremely challenging. Finally, with the aim of ascertaining the location of the screen, knowing the screen orientation ψ could be necessary, especially when the screen is highly anisotropic. Once a reliable distance to the screen can be obtained, the types of scattering structures and processes could be confirmed. In our sample, PSRs J0953+0755 and 1932+1059 are surrounded by a nebula (Ruan et al. 2020; Manning & Willmore 1994; Hui & Becker 2008). Further studies in this direction are deferred to a future paper.
Scintillation-arc properties for nine pulsars with clearly detected scintillation arcs in our LOFAR data.
3.2.2 The Spatial Scale of the Screens
We note that the delay axis (Y-axis) of the secondary spectra is proportional to the time delay relative to an undeflected ray. From this, we can derive the angular extent of the scattering material parallel to the direction of the pulsar velocity, as given by (Cordes et al. 2006):
 (10)
(10)
where τ is time delay derived from the Y-axis of the secondary spectrum (see Fig. 3). This corresponds to a linear extent of
 (11)
(11)
We find that the spatial scale of the screens we detected are all on the order of au, based on the maximum detected delay for our scintillation arcs. Specifically, the size of the scattering structure for PSR J0837+0610 is 0.12 au, consistent with the earlier findings of 0.2 au (Hill et al. 2005); however, it is significantly smaller than the 16au reported by (Brisken et al. 2010). The inconsistency between our value and that of (Brisken et al. 2010) is likely due to either a lack in sensitivity in our LOFAR data (the much higher sensitivity of the AO-GBT combination used by (Brisken et al. 2010) allowed detection of arcs out to far greater delays than in our data on this pulsar) or to the fact that a different screen dominates the scattering, given that there is a larger discrepancy between our scintillation bandwidth and theirs. For PSRs J0953+0755, J1921+2153 and J2018+2839, the interstellar scattering delay is beyond the Nyquist frequency, so only a lower limit on the extent of the scattering structure can be given (see Table 3) and higher frequency resolution is needed to fully determine the arc extent.
3.2.3 Impact on Pulsar Timing Arrays
In addition to IISM studies discussed in this paper, pulsar observations can also be used in high-precision timing experiments that have a wide range of applications (see, e.g., Lorimer & Kramer 2005, and reference therein). Probably the highest-impact such experiment is that of the pulsar timing arrays (PTAs, Foster & Backer 1990; Verbiest et al. 2021), which aim to use the high rotational stability of radio pulsars to detect the faint imprint of extragalactic gravitational waves on the space-time metric at Earth. While this experiment has a large number of potential noise sources to contend with (see Verbiest & Shaifullah 2018, for a review), the time-variable effects of the IISM are likely one of the most important ones (Lam et al. 2017) and studies such as ours can help these efforts in a number of ways.
Currently, PTAs rely on nearby millisecond pulsars to minimize the scattering effects, but the inclusion of more pulsars would significantly increase the sensitivity of the array (Siemens et al. 2013). Scattering, however, reduces the sharpness of the pulse and therefore its achievable timing precision; this is an effect that could be mitigated by new methods such as cyclic spectroscopy (Demorest 2011; Dolch et al. 2021). Time-variable scattering, however, could prove more problematic (Hemberger & Stinebring 2008; Main et al. 2020).
Since the observable spatial scale of the scattering screen is frequency-dependent, at LOFAR frequencies we can measure changes and see features of the scattering screens on much larger angular scales, which allows any anomalous scattering features to be detected long before they risk contaminating higher-frequency observations. Alternatively, monitoring refractive effects at low frequencies could provide an early-warning system for intense IISM studies at higher frequencies as well. The census presented in this paper intends to be a first step in this direction by casting some light on the observational requirements for high-quality IISM studies at low frequencies, and by identifying sources that lend themselves well for such experiments. In subsequent papers in this series, we will expand on the results shown here by presenting monitoring results and their relation to time series of interstellar dispersion, which more directly affects PTA timing efforts.
4 Conclusion and Future Work
We have reported the first scintillation census of 31 pulsars with LOFAR in the 120–180 MHz frequency band. Large asymmetries in the scintillation arcs reflect large-scale gradients of DM. The frequency dependencies of Δvd imply that the turbulent features of the interstellar medium deviate from Kolmogorov turbulence at various levels for only a minority of sources (2/15). Highly asymmetric arcs from nine pulsars have been detected, and these arcs were used to constrain the fractional distance to the phase changing screen.
Of particular interest are the independent measurement of the frequency-scaling factor of Δvd and the extraordinary measurement of power at an interstellar scattering delay of 3 ms in the secondary spectrum of PSR J2219+4754 which provide meaningful illustrations of the power of low-frequency observations for IISM studies. Moreover, low-frequency data have great advantages for echo detection (Michilli et al. 2018). Further research into the relations between diffractive scintillation, scintillation arcs, and echoes could be very valuable.
Long-term scintillation monitoring with LOFAR of the pulsars studied here has commenced and will be reported on in a follow-up paper and is useful in testing different scintillation models. Annual variations of the scintillation timescale and arc curvature resulting from Earth’s motion have been confirmed and will be part of that analysis, as well as the study of a possible link between DM variations and scintillation arcs.
Acknowledgements
We thank the anonymous referee for the constructive comments and suggestions, which helped us to improve the presentation of this paper. The authors thank Dan Stinebring for inspiring discussions that first got this research started, Bill Coles for useful discussions and support throughout this work and Vlad Kondratiev for useful discussions and extensive observation and processing support. J.P.W.V. acknowledges support by the Deutsche Forschungsgemeinschaft (DFG) through the Heisenberg programme (Project No. 433075039). Y.L. acknowledges support from the China scholarship council (No. 201808510133). M.B. acknowledges funding by the Deutsche Forschungsgemeinschaft (DFG, German Research Foundation) under Germany’s Excellence Strategy – EXC 2121 “Quantum Universe” – 390833306. Part of this work is based on data obtained with the International LOFAR Telescope (ILT) Core observations under project codes: LC13_031, LT14_006, LC15_030. LOFAR (van Haarlem et al. 2013) is the Low Frequency Array designed and constructed by ASTRON. It has observing, data processing, and data storage facilities in several countries, that are owned by various parties (each with their own funding sources), and that are collectively operated by the ILT foundation under a joint scientific policy. The ILT resources have benefitted from the following recent major funding sources: CNRS-INSU, Observatoire de Paris and Universite d’Orleans, France; BMBF, MIWF-NRW, MPG, Germany; Science Foundation Ireland (SFI), Department of Business, Enterprise and Innovation (DBEI), Ireland; NWO, The Netherlands; The Science and Technology Facilities Council, UK. This paper uses and is benefited from data obtained with the German and French LOFAR stations, during station-owners time and ILT time allocated under project codes LC0_014, LC1_048, LC2_011, LC3_029, LC4_025, LT5_001, LC9_039, LT10_014, LC14_012, and LC15_009. We made use of data from the Effelsberg (DE601) LOFAR station funded by the Max-Planck-Gesellschaft; the Unterweilenbach (DE602) LOFAR station funded by the Max-Planck-Institut fur Astrophysik, Garching; the Tautenburg (DE603) LOFAR station funded by the State of Thuringia, supported by the European Union (EFRE) and the Federal Ministry of Education and Research (BMBF) Verbundforschung project D-LOFAR I (grant 05A08ST1); the Potsdam (DE604) LOFAR station funded by the Leibniz-Institut fur Astrophysik, Potsdam; the Julich (DE605) LOFAR station supported by the BMBF Verbundforschung project DLOFAR I (grant 05A08LJ1); and the Norderstedt (DE609) LOFAR station funded by the BMBF Verbundforschung project D-LOFAR II (grant 05A11LJ1). The observations of the German LOFAR stations were carried out in stand-alone GLOW mode, which is technically operated and supported by the Max-Planck-Institut fur Radioastronomie, the Forschungszentrum Julich and Bielefeld University. We acknowledge support and operation of the GLOW network, computing and storage facilities by the FZ-Julich, the MPIfR and Bielefeld University and financial support from BMBF D-LOFAR III (grant 05A14PBA) and D-LOFAR IV (grant 05A17PBA), and by the states of Nordrhein-Westfalia and Hamburg. We acknowledge the work of A. Horneffer in setting up the GLOW network and initial recording machines. LOFAR station FR606 is hosted by the Nan^ay Radio Observatory and is operated by Paris Observatory, associated with the French Centre National de la Recherche Scientifique (CNRS) and Universite d’Orleans.
Appendix A Scintillation Bandwidth from Literature
The table below summarizes all previously published values for the scintillation bandwidth of the pulsars included in our study. The values given are also included in Figure 6.
Previously published measurements of scintillation bandwidth Δvd for pulsars included in this paper.
References
- Ahuja, A. L., Gupta, Y., Mitra, D., & Kembhavi, A. K. 2005, MNRAS, 357, 1013 [NASA ADS] [CrossRef] [Google Scholar]
- Armstrong, J. W., & Rickett, B. J. 1981, MNRAS, 194, 623 [NASA ADS] [CrossRef] [Google Scholar]
- Armstrong, J. W., Rickett, B. J., & Spangler, S. R. 1995, ApJ, 443, 209 [Google Scholar]
- Balasubramanian, V., & Krishnamohan, S. 1985, J. Astrophys. Astr., 6, 35 [NASA ADS] [CrossRef] [Google Scholar]
- Bansal, K., Taylor, G. B., Stovall, K., & Dowell, J. 2019, ApJ, 875, 146 [NASA ADS] [CrossRef] [Google Scholar]
- Bates, S. D., Lorimer, D. R., & Verbiest, J. P. W. 2013, MNRAS, 431, 1352 [Google Scholar]
- Bell, M. E., Murphy, T., Johnston, S., et al. 2016, MNRAS, 461, 908 [NASA ADS] [CrossRef] [Google Scholar]
- Bhat, N. D. R., Gupta, Y., & Rao, A. P. 1998, ApJ, 500, 262 [NASA ADS] [CrossRef] [Google Scholar]
- Bhat, N. D. R., Gupta, Y., & Rao, A. P. 1999a, ApJ, 514, 249 [NASA ADS] [CrossRef] [Google Scholar]
- Bhat, N. D. R., Rao, A. P., & Gupta, Y. 1999b, ApJS, 121, 483 [NASA ADS] [CrossRef] [Google Scholar]
- Bhat, N. D. R., Rao, A. P., & Gupta, Y. 1999c, ApJ, 514, 272 [NASA ADS] [CrossRef] [Google Scholar]
- Bhat, N. D. R., Ord, S. M., Tremblay, S. E., McSweeney, S. J., & Tingay, S. J. 2016, ApJ, 818, 86 [NASA ADS] [CrossRef] [Google Scholar]
- Bilous, A. V., Kondratiev, V. I., Kramer, M., et al. 2016, A&A, 591, A134 [NASA ADS] [CrossRef] [EDP Sciences] [Google Scholar]
- Bilous, A. V., Grießmeier, J. M., Pennucci, T., et al. 2022, A&A, 658, A143 [NASA ADS] [CrossRef] [EDP Sciences] [Google Scholar]
- Bondonneau, L., Grießmeier, J. M., Theureau, G., et al. 2021, A&A, 652, A34 [NASA ADS] [CrossRef] [EDP Sciences] [Google Scholar]
- Brisken, W. F., Benson, J. M., Goss, W. M., & Thorsett, S. E. 2002, ApJ, 571, 906 [NASA ADS] [CrossRef] [Google Scholar]
- Brisken, W. F., Macquart, J. P., Gao, J. J., et al. 2010, ApJ, 708, 232 [NASA ADS] [CrossRef] [Google Scholar]
- Britton, M. C., Gwinn, C. R., & Ojeda, M. J. 1998, ApJ, 501, L101 [NASA ADS] [CrossRef] [Google Scholar]
- Coles, W. A., McLaughlin, M. A., Rickett, B. J., Lyne, A. G., & Bhat, N. D. R. 2005, ApJ, 623, 392 [NASA ADS] [CrossRef] [Google Scholar]
- Coles, W. A., Rickett, B. J., Gao, J. J., Hobbs, G., & Verbiest, J. P. W. 2010, ApJ, 717, 1206 [NASA ADS] [CrossRef] [Google Scholar]
- Cordes, J. M. 1986, ApJ, 311, 183 [NASA ADS] [CrossRef] [Google Scholar]
- Cordes, J. M., & Lazio, T. J. W. 2001, ApJ, 549, 997 [NASA ADS] [CrossRef] [Google Scholar]
- Cordes, J. M., & Lazio, T. J. W. 2002, preprint [arXiv:astro-ph/0207156] [Google Scholar]
- Cordes, J. M., & Rickett, B. J. 1998, ApJ, 507, 846 [NASA ADS] [CrossRef] [Google Scholar]
- Cordes, J. M., Weisberg, J. M., & Boriakoff, V. 1985, ApJ, 288, 221 [NASA ADS] [CrossRef] [Google Scholar]
- Cordes, J. M., Rickett, B. J., Stinebring, D. R., & Coles, W. A. 2006, ApJ, 637, 346 [NASA ADS] [CrossRef] [Google Scholar]
- Cordes, J. M., Shannon, R. M., & Stinebring, D. R. 2016, ApJ, 817, 16 [Google Scholar]
- Daszuta, M., Lewandowski, W., & Kijak, J. 2013, MNRAS, 436, 2492 [NASA ADS] [CrossRef] [Google Scholar]
- Deller, A. T., Goss, W. M., Brisken, W. F., et al. 2019, ApJ, 875, 100 [NASA ADS] [CrossRef] [Google Scholar]
- Demorest, P. B. 2011, MNRAS, 416, 2821 [NASA ADS] [CrossRef] [Google Scholar]
- Dolch, T., Stinebring, D. R., Jones, G., et al. 2021, ApJ, 913, 98 [NASA ADS] [CrossRef] [Google Scholar]
- Donner, J. Y., Verbiest, J. P. W., Tiburzi, C., et al. 2019, A&A, 624, A22 [NASA ADS] [CrossRef] [EDP Sciences] [Google Scholar]
- Donner, J. Y., Verbiest, J. P. W., Tiburzi, C., et al. 2020, A&A, 644, A153 [EDP Sciences] [Google Scholar]
- Fadeev, E. N., Andrianov, A. S., Burgin, M. S., et al. 2018, MNRAS, 480, 4199 [NASA ADS] [CrossRef] [Google Scholar]
- Foster, R. S., & Backer, D. C. 1990, ApJ, 361, 300 [NASA ADS] [CrossRef] [Google Scholar]
- Geyer, M., Karastergiou, A., Kondratiev, V. I., et al. 2017, MNRAS, 470, 2659 [NASA ADS] [CrossRef] [Google Scholar]
- Goodman, J., & Narayan, R. 1985, MNRAS, 214, 519 [NASA ADS] [Google Scholar]
- Gothoskar, P., & Gupta, Y. 2000, ApJ, 531, 345 [NASA ADS] [CrossRef] [Google Scholar]
- Gupta, Y. 1995, ApJ, 451, 717 [NASA ADS] [CrossRef] [Google Scholar]
- Gupta, Y., Rickett, B. J., & Lyne, A. G. 1994, MNRAS, 269, 1035 [NASA ADS] [CrossRef] [Google Scholar]
- Gwinn, C. R. 2019, MNRAS, 486, 2809 [NASA ADS] [CrossRef] [Google Scholar]
- Hemberger, D. A., & Stinebring, D. R. 2008, ApJ, 674, L37 [NASA ADS] [CrossRef] [Google Scholar]
- Hill, A. S., Stinebring, D. R., Barnor, H. A., Berwick, D. E., & Webber, A. B. 2003, ApJ, 599, 457 [NASA ADS] [CrossRef] [Google Scholar]
- Hill, A. S., Stinebring, D. R., Asplund, C. T., et al. 2005, ApJ, 619, L171 [NASA ADS] [CrossRef] [Google Scholar]
- Hotan, A. W., van Straten, W., & Manchester, R. N. 2004, PASA, 21, 302 [Google Scholar]
- Hui, C. Y., & Becker, W. 2008, A&A, 486, 485 [NASA ADS] [CrossRef] [EDP Sciences] [Google Scholar]
- Jankowski, F., van Straten, W., Keane, E. F., et al. 2018, MNRAS, 473, 4436 [Google Scholar]
- Johnston, S., Nicastro, L., & Koribalski, B. 1998, MNRAS, 297, 108 [NASA ADS] [CrossRef] [Google Scholar]
- Kondratiev, V. I., Popov, M. V., Soglasnov, V. A., & Kostyuk, S. V. 2001, Ap&SS, 278, 43 [NASA ADS] [CrossRef] [Google Scholar]
- Kondratiev, V. I., Verbiest, J. P. W., Hessels, J. W. T., et al. 2016, A&A, 585, A128 [NASA ADS] [CrossRef] [EDP Sciences] [Google Scholar]
- Krishnakumar, M. A., Joshi, B. C., & Manoharan, P. K. 2017, ApJ, 846, 104 [NASA ADS] [CrossRef] [Google Scholar]
- Krishnakumar, M. A., Maan, Y., Joshi, B. C., & Manoharan, P. K. 2019, ApJ, 878, 130 [NASA ADS] [CrossRef] [Google Scholar]
- Lam, M. T., Cordes, J. M., Chatterjee, S., et al. 2017, ApJ, 834, 35 [Google Scholar]
- Lazarus, P., Karuppusamy, R., Graikou, E., et al. 2016, MNRAS, 458, 868 [Google Scholar]
- Lentati, L., Kerr, M., Dai, S., et al. 2017, MNRAS, 468, 1474 [NASA ADS] [CrossRef] [Google Scholar]
- Levin, L., McLaughlin, M. A., Jones, G., et al. 2016, ApJ, 818, 166 [NASA ADS] [CrossRef] [Google Scholar]
- Lin, F. X., Main, R. A., Verbiest, J. P. W., Kramer, M., & Shaifullah, G. 2021, MNRAS, 506, 2824 [NASA ADS] [CrossRef] [Google Scholar]
- Liu, S., Pen, U.-L., Macquart, J. P., Brisken, W., & Deller, A. 2016, MNRAS, 458, 1289 [NASA ADS] [CrossRef] [Google Scholar]
- Lorimer, D. R., & Kramer, M. 2005, Handbook of Pulsar Astronomy (Cambridge University Press) [Google Scholar]
- Main, R., van Kerkwijk, M., Pen, U.-L., Mahajan, N., & Vanderlinde, K. 2017, ApJ, 840, L15 [NASA ADS] [CrossRef] [Google Scholar]
- Main, R. A., Sanidas, S. A., Antoniadis, J., et al. 2020, MNRAS, 499, 1468 [NASA ADS] [CrossRef] [Google Scholar]
- Malofeev, V. M., Smirnova, T. V., Soin, A. G., & Shapovalova, N. V. 1995, Astron. Lett., 21, 619 [NASA ADS] [Google Scholar]
- Manning, R. A., & Willmore, A. P. 1994, MNRAS, 266, 635 [NASA ADS] [CrossRef] [Google Scholar]
- Michilli, D., Hessels, J. W. T., Donner, J. Y., et al. 2018, MNRAS, 476, 2704 [NASA ADS] [CrossRef] [Google Scholar]
- Narayan, R. 1992, Philos. Trans. R. Soc. Lond. A, 341, 151 [NASA ADS] [CrossRef] [Google Scholar]
- Niu, H. B., Esamdin, A., & Wang, N. 2013, Ap&SS, 347, 327 [NASA ADS] [CrossRef] [Google Scholar]
- Ord, S. M., Bailes, M., & van Straten, W. 2002, ApJ, 574, L75 [NASA ADS] [CrossRef] [Google Scholar]
- Pen, U.-L., & Levin, Y. 2014, MNRAS, 442, 3338 [Google Scholar]
- Pen, U. L., Macquart, J. P., Deller, A. T., & Brisken, W. 2014, MNRAS, 440, L36 [NASA ADS] [CrossRef] [Google Scholar]
- Phillips, J. A., & Clegg, A. W. 1992, Nature, 360, 137 [NASA ADS] [CrossRef] [Google Scholar]
- Putney, M. L., & Stinebring, D. R. 2006, Chin. J. Atron. Astrophys., Suppl. 2, 6, 233 [CrossRef] [Google Scholar]
- Reardon, D. J., Coles, W. A., Hobbs, G., et al. 2019, MNRAS, 485, 4389 [NASA ADS] [CrossRef] [Google Scholar]
- Reardon, D. J., Coles, W. A., Bailes, M., et al. 2020, ApJ, 904, 104 [NASA ADS] [CrossRef] [Google Scholar]
- Rickett, B. J. 1969, Nature, 221, 158 [NASA ADS] [CrossRef] [Google Scholar]
- Rickett, B. J. 1970, MNRAS, 150, 67 [NASA ADS] [Google Scholar]
- Rickett, B. J. 1990, ARA&A, 28, 561 [NASA ADS] [CrossRef] [Google Scholar]
- Rickett, B. J., Coles, W. A., & Bourgois, G. 1984, A&A, 134, 390 [NASA ADS] [Google Scholar]
- Rickett, B. J., Coles, W. A., & Markkanen, J. 2000, ApJ, 533, 304 [NASA ADS] [CrossRef] [Google Scholar]
- Rickett, B., Johnston, S., Tomlinson, T., & Reynolds, J. 2009, MNRAS, 395, 1391 [NASA ADS] [CrossRef] [Google Scholar]
- Rickett, B. J., Coles, W. A., Nava, C. F., et al. 2014, ApJ, 787, 161 [NASA ADS] [CrossRef] [Google Scholar]
- Rickett, B. J., Stinebring, D. R., Zhu, H., & Minter, A. H. 2021, ApJ, 907, 49 [NASA ADS] [CrossRef] [Google Scholar]
- Roberts, J. A., & Ables, J. G. 1982, MNRAS, 201, 1119 [NASA ADS] [CrossRef] [Google Scholar]
- Romani, R. W., Narayan, R., & Blandford, R. 1986, MNRAS, 220, 19 [NASA ADS] [Google Scholar]
- Romani, R. W., Blandford, R. D., & Cordes, J. M. 1987, Nature, 328, 324 [NASA ADS] [CrossRef] [Google Scholar]
- Ruan, D., Taylor, G. B., Dowell, J., et al. 2020, MNRAS, 495, 2125 [NASA ADS] [CrossRef] [Google Scholar]
- Safutdinov, E. R., Popov, M. V., Gupta, Y., Mitra, D., & Kumar, U. 2017, Astron. Rep., 61, 406 [NASA ADS] [CrossRef] [Google Scholar]
- Sanidas, S., Cooper, S., Bassa, C. G., et al. 2019, A&A, 626, A104 [NASA ADS] [CrossRef] [EDP Sciences] [Google Scholar]
- Scheuer, P. A. G. 1968, Nature, 218, 920 [NASA ADS] [CrossRef] [Google Scholar]
- Shishov, V. I., Smirnova, T. V., Gwinn, C. R., et al. 2017, MNRAS, 468, 3709 [NASA ADS] [CrossRef] [Google Scholar]
- Sieber, W. 1982, A&A, 113, 311 [NASA ADS] [Google Scholar]
- Siemens, X., Ellis, J., Jenet, F., & Romano, J. D. 2013, Class. Quant. Grav., 30, 224015 [Google Scholar]
- Smirnova, T. V., & Shishov, V. I. 2008, Astron. Rep., 52, 736 [NASA ADS] [CrossRef] [Google Scholar]
- Smirnova, T. V., Shishov, V. I., Sieber, W., et al. 2006, A&A, 455, 195 [NASA ADS] [CrossRef] [EDP Sciences] [Google Scholar]
- Smirnova, T. V., Shishov, V. I., Popov, M. V., et al. 2014, ApJ, 786, 115 [NASA ADS] [CrossRef] [Google Scholar]
- Smirnova, T. V., Shishov, V. I., Andrianov, A. S., et al. 2020, MNRAS, 496, 5149 [NASA ADS] [CrossRef] [Google Scholar]
- Smith, F. G., & Wright, N. C. 1985, MNRAS, 214, 97 [NASA ADS] [CrossRef] [Google Scholar]
- Spangler, S. R., & Gwinn, C. R. 1990, ApJ, 353, L29 [NASA ADS] [CrossRef] [Google Scholar]
- Stinebring, D. R., Faison, M. D., & McKinnon, M. M. 1996, ApJ, 460, 460 [NASA ADS] [CrossRef] [Google Scholar]
- Stinebring, D. R., McLaughlin, M. A., Cordes, J. M., et al. 2001, ApJ, 549, L97 [NASA ADS] [CrossRef] [Google Scholar]
- Stinebring, D. R., Rickett, B. J., & Ocker, S. K. 2019, ApJ, 870, 82 [NASA ADS] [CrossRef] [Google Scholar]
- Taylor, J. H., & Cordes, J. M. 1993, ApJ, 411, 674 [Google Scholar]
- Trang, F. S., & Rickett, B. J. 2007, ApJ, 661, 1064 [NASA ADS] [CrossRef] [Google Scholar]
- van Haarlem, M. P., Wise, M. W., Gunst, A. W., et al. 2013, A&A, 556, A2 [NASA ADS] [CrossRef] [EDP Sciences] [Google Scholar]
- van Straten, W., & Bailes, M. 2011, PASA, 28, 1 [Google Scholar]
- van Straten, W., Demorest, P., & Oslowski, S. 2012, Astron. Res. Technol., 9, 237 [NASA ADS] [Google Scholar]
- Verbiest, J. P. W., & Shaifullah, G. M. 2018, Class. Quant. Grav., 35, 133001 [NASA ADS] [CrossRef] [Google Scholar]
- Verbiest, J. P. W., Oslowski, S., & Burke-Spolaor, S. 2021, Handbook of Gravitational Wave Astronomy, Eds. C. Bambi, S. Katsanevas & K. D. Kokkotas (Springer) [Google Scholar]
- Walker, M. A., Melrose, D. B., Stinebring, D. R., & Zhang, C. M. 2004, MNRAS, 354, 43 [NASA ADS] [CrossRef] [Google Scholar]
- Walker, M. A., Koopmans, L. V. E., Stinebring, D. R., & van Straten, W. 2008, MNRAS, 388, 1214 [NASA ADS] [Google Scholar]
- Walker, M. A., de Bruyn, A. G., & Bignall, H. E. 2009, MNRAS, 397, 447 [Google Scholar]
- Walker, M. A., Demorest, P. B., & van Straten, W. 2013, ApJ, 779, 99 [NASA ADS] [CrossRef] [Google Scholar]
- Wang, N., Manchester, R. N., Johnston, S., et al. 2005, MNRAS, 358, 270 [NASA ADS] [CrossRef] [Google Scholar]
- Wang, N., Yan, Z., Manchester, R. N., & Wang, H. X. 2008, MNRAS, 385, 1393 [NASA ADS] [CrossRef] [Google Scholar]
- Wang, P. F., Han, J. L., Han, L., et al. 2018, A&A, 618, A186 [NASA ADS] [CrossRef] [EDP Sciences] [Google Scholar]
- Xu, S., & Zhang, B. 2017, ApJ, 835, 2 [NASA ADS] [CrossRef] [Google Scholar]
- Xue, M., Bhat, N. D. R., Tremblay, S. E., et al. 2017, PASA, 34, e070 [NASA ADS] [CrossRef] [Google Scholar]
- Yao, J. M., Manchester, R. N., & Wang, N. 2017, ApJ, 835, 29 [NASA ADS] [CrossRef] [Google Scholar]
- Yao, J.-M., Zhu, W.-W., Wang, P., et al. 2020, Res. Astron. Astrophys., 20, 076 [CrossRef] [Google Scholar]
- Yao, J., Zhu, W., Manchester, R. N., et al. 2021, Nat. Astron., 5, 788 [NASA ADS] [CrossRef] [Google Scholar]
- Zhou, Y., & Speziale, C. G. 1998, Appl. Mech. Rev., 51, 267 [NASA ADS] [CrossRef] [Google Scholar]
This parameter quantifies the integrated electron density between us and the pulsar:  .
.
Available from https://github.com/larskuenkel/iterative_cleaner
The ACF combines the signal from all scintles within the observation, but in practice this is still insufficient for many sources.
The DISS scale or the spatial scale of diffractive scattering, sd, is defined as the transverse separation within which incident waves have a root mean square phase difference of one radian or less.
All Tables
Properties of the observations and scintillation characteristics for the 15 pulsars with detectable scintillation.
Observational data for pulsars for which the scintillation bandwidth Δνd could not be successfully derived.
Scintillation-arc properties for nine pulsars with clearly detected scintillation arcs in our LOFAR data.
Previously published measurements of scintillation bandwidth Δvd for pulsars included in this paper.
All Figures
|
Fig. 1 Source sample selection. All pulsars with a DM lower than 50 pc cm−3 are shown. The star symbols represent pulsars with a published flux density at 150 MHz. The dot markers represent the pulsars for which no published flux density at 150 MHz exists; in these cases, the flux densities were extrapolated from higher frequencies, using a conservative spectral index of −1.4, unless a spectral-index measurement was previously published. The green symbols represent pulsars for which we detected scintillation in our LOFAR data, while red symbols represent pulsars for which scintillation was not detectable. Orange symbols indicate sources for which the scintillation was detected but not resolved (see text). Sources for which scintillation arcs were published in literature are encircled with a gray circle, while scintillation arcs presented in this work are represented by green circles. |
| In the text | |
|
Fig. 2 Dynamic spectra of 15 scintillating pulsars with LOFAR. The white patches were removed because of radio-frequency interference. The color scheme indicates the pulse S/N ranging from blue |
| In the text | |
|
Fig. 3 Secondary spectra of 15 scintillating pulsars detected with LOFAR in the frequency range 145–155MHz (except for PSR J0814+7429: 125 ± 5 MHz; PSR J0953+0755: 150 ± 20 MHz; and PSR J2018+2839: 175 ± 5 MHz). The black parabolae are the resulting model fits with parameters given in Table 3. |
| In the text | |
|
Fig. 4 Dynamic spectra of PSRs J1012+5307 and J1509+5531 from the LOFAR core and DE602, respectively, illustrating the challenges inherent to scintillation detection at low frequencies. While scintillation is clearly visible in the PSR J1509+5531 data, higher frequency resolution is required to allow for the accurate determination of the scintillation parameters. For PSR J1012+5307, the resolution is sufficient, but the remaining S/N for individual scintles is insufficient to allow for a clear analysis. While the dynamic spectrum does combine data from all scintles across the observation, it still returns a S/N that is too low for reliable measurements in this case. |
| In the text | |
|
Fig. 5 Nulling behavior of pulsars in our sample. PSRs J0034−0721 and J2022+5154 show nulling behavior as shown above. The top row shows the integrated profile of a 1-h observation with FR606 across the frequency range 125–150MHz for PSR J0034−0721 (left) and of a half-hour observation with the LOFAR core across the frequency range 149–153 MHz. The intensity-phase plots of these data are shown in the bottom row as a function of the integration number for the PSR J0034−0721 data, which have a 10-s subintegration length, and as a function of the pulse number for the single-pulse data on PSR J2022+5154. The intermittent character of their emission makes the determination of the scintillation timescale complicated, but the scintillation bandwidth can still be determined using standard methods. |
| In the text | |
|
Fig. 6 Scintillation bandwidth versus the observing frequency in log-log scale. Filled symbols designate our LOFAR measurements presented in this paper, and open symbols are previously published values collated from literature and given (with references) in the table in Appendix A. The black dashed lines with a slope of α show the best fit to the Δvd values across our LOFAR observing band. The gray dashed line corresponds to the Kolmogorov spectrum with α = 4.4, which is only plotted in case the best-fit line is inconsistent with the Kolmogorov spectrum. |
| In the text | |
Current usage metrics show cumulative count of Article Views (full-text article views including HTML views, PDF and ePub downloads, according to the available data) and Abstracts Views on Vision4Press platform.
Data correspond to usage on the plateform after 2015. The current usage metrics is available 48-96 hours after online publication and is updated daily on week days.
Initial download of the metrics may take a while.