Fig. 6
Download original image
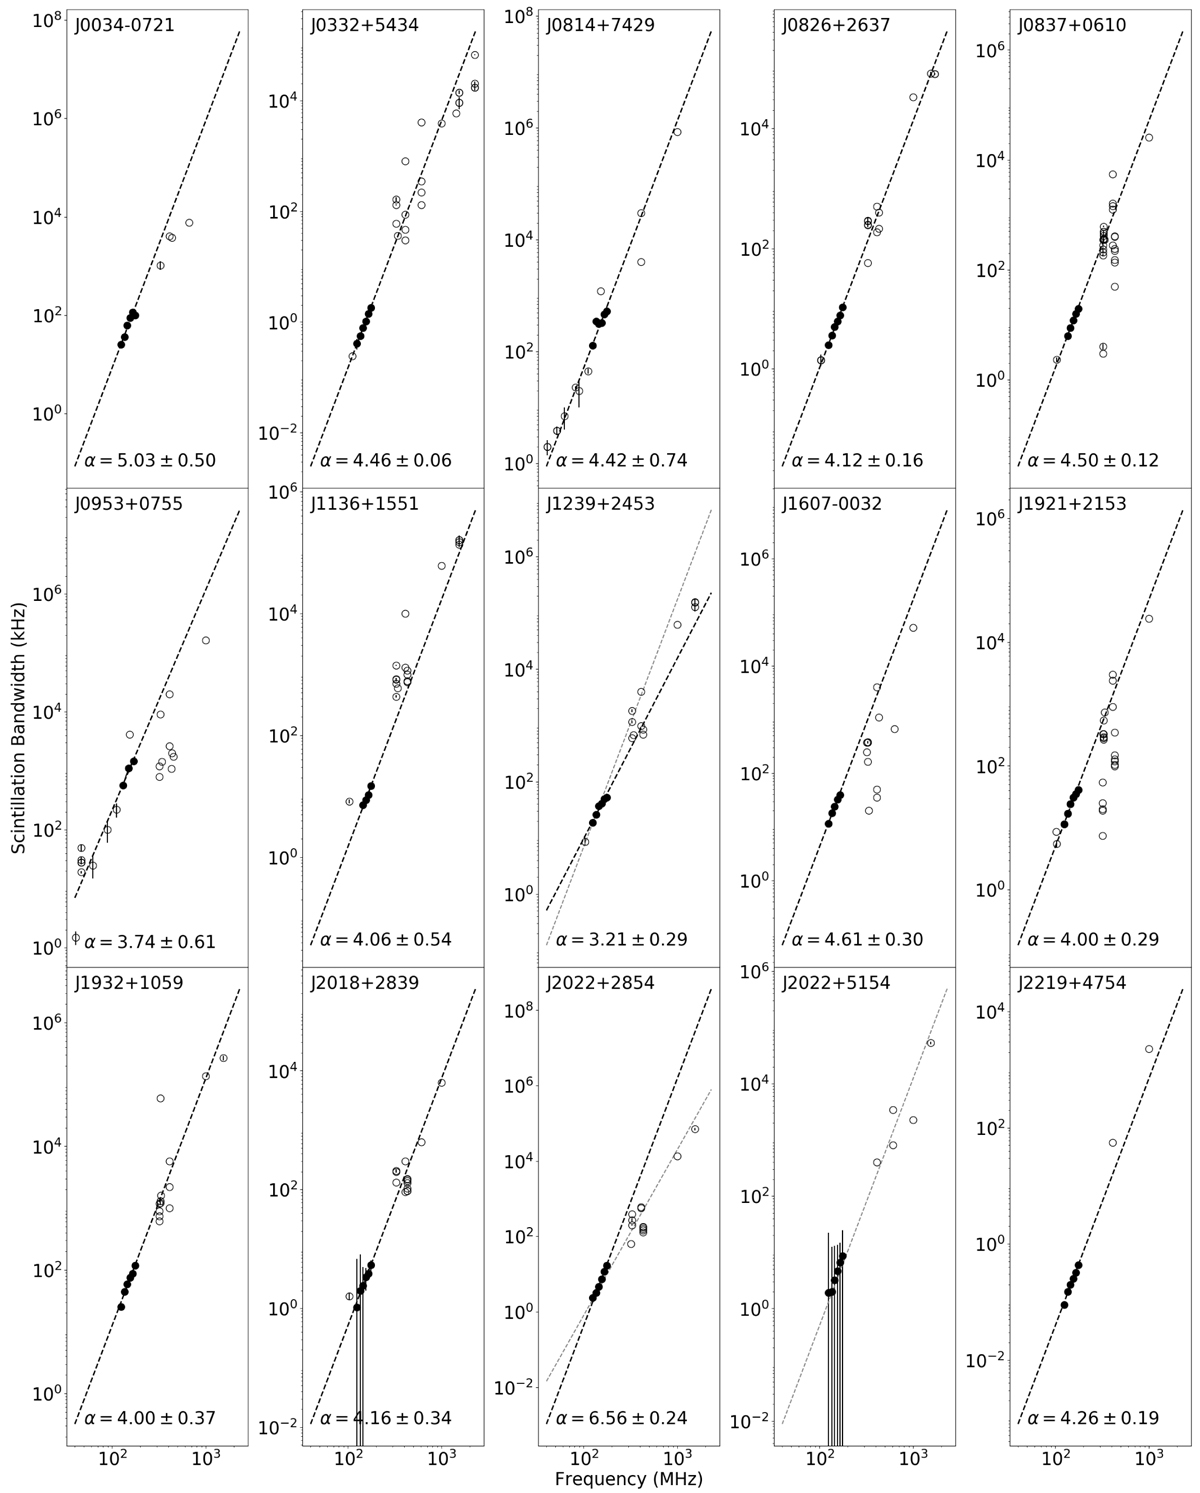
Scintillation bandwidth versus the observing frequency in log-log scale. Filled symbols designate our LOFAR measurements presented in this paper, and open symbols are previously published values collated from literature and given (with references) in the table in Appendix A. The black dashed lines with a slope of α show the best fit to the Δvd values across our LOFAR observing band. The gray dashed line corresponds to the Kolmogorov spectrum with α = 4.4, which is only plotted in case the best-fit line is inconsistent with the Kolmogorov spectrum.
Current usage metrics show cumulative count of Article Views (full-text article views including HTML views, PDF and ePub downloads, according to the available data) and Abstracts Views on Vision4Press platform.
Data correspond to usage on the plateform after 2015. The current usage metrics is available 48-96 hours after online publication and is updated daily on week days.
Initial download of the metrics may take a while.