Fig. 5
Download original image
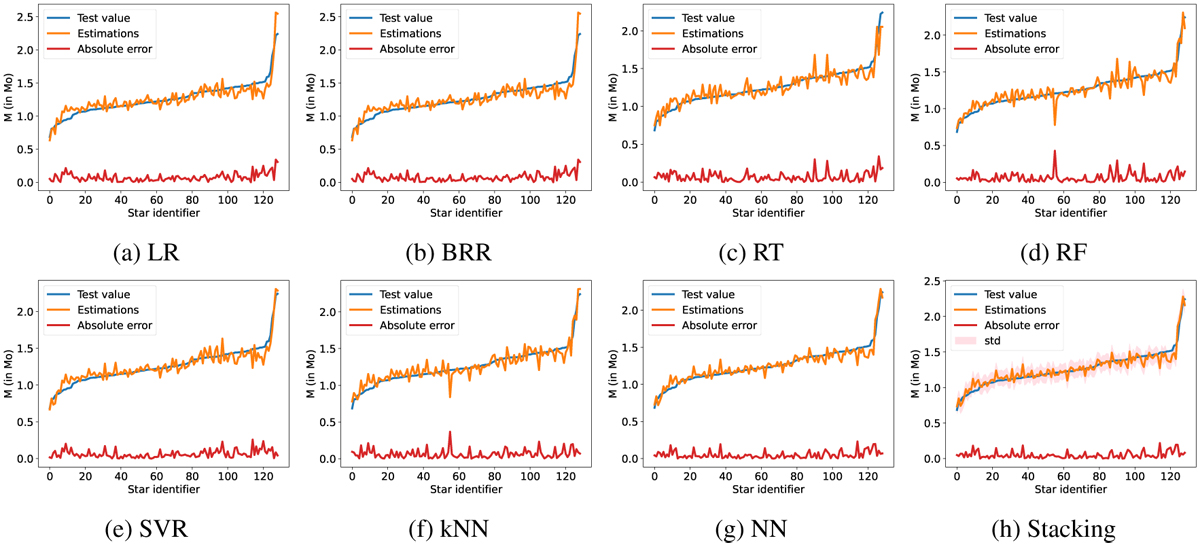
Detailed estimates of the stellar mass for every test sample of all the AI models proposed in this paper. The orange line shows the masses estimated by the AI techniques, and the blue line shows the corresponding test value. The red line represents the absolute error between these two previous quantities. The X-axis shows the identifier of each test star when they have been sorted in increasing order of mass.
Current usage metrics show cumulative count of Article Views (full-text article views including HTML views, PDF and ePub downloads, according to the available data) and Abstracts Views on Vision4Press platform.
Data correspond to usage on the plateform after 2015. The current usage metrics is available 48-96 hours after online publication and is updated daily on week days.
Initial download of the metrics may take a while.