Fig. 3.
Download original image
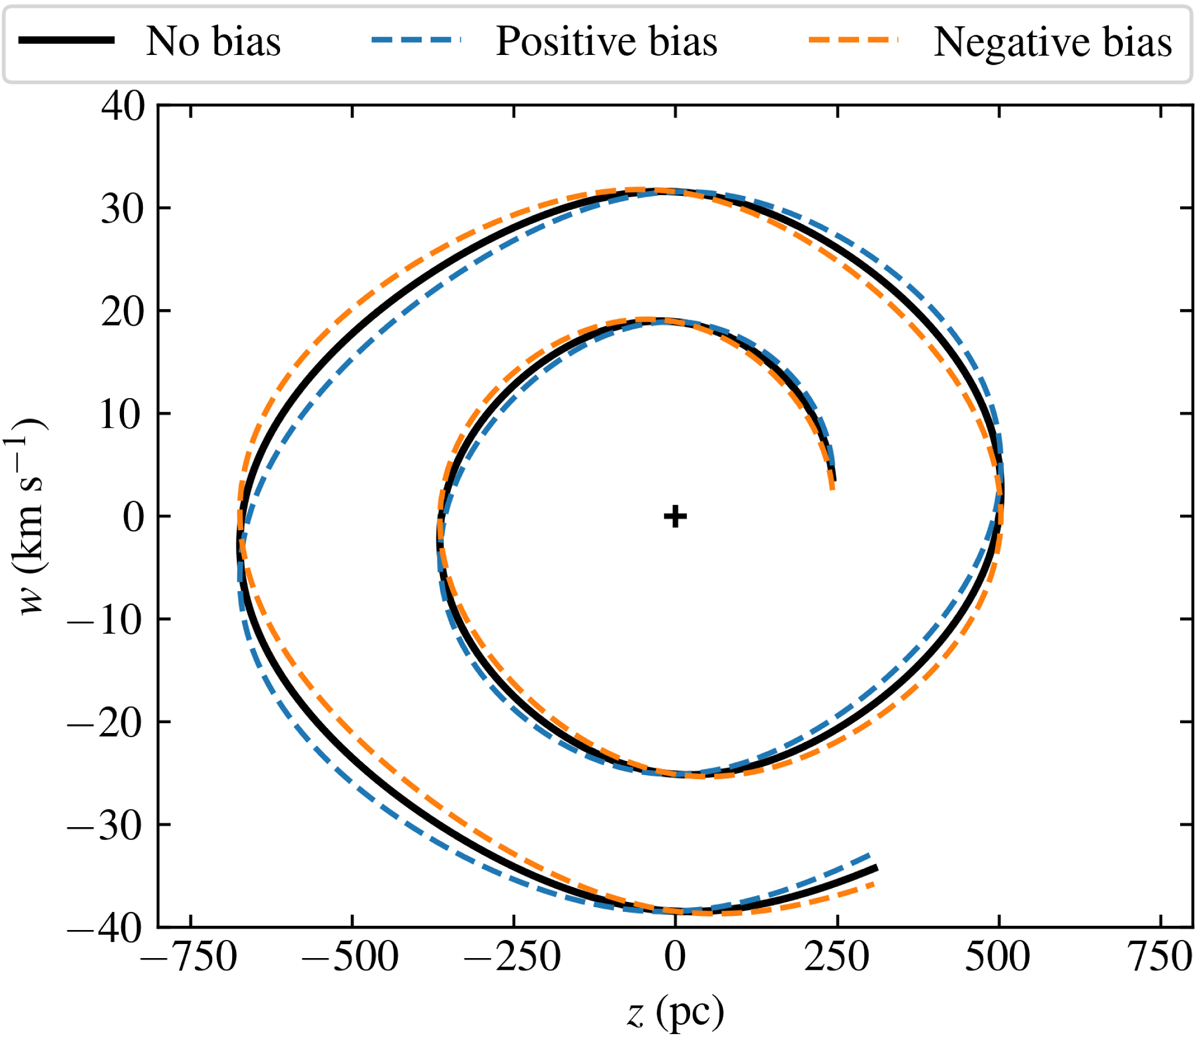
Shape of the phase-space spiral, represented as a one-dimensional line in the (z, w)-plane, when biased by faulty radial velocity assignments. The dashed blue and orange lines show the spiral when radial velocity assignment is biased by ±10 km s−1, assuming that the spiral is observed at a distance of ![]() . The spiral is plotted for vertical energies in range Ez ∈ [Φ(250 pc),Φ(800 pc)]. The plus sign marks the origin of the (z, w)-plane.
. The spiral is plotted for vertical energies in range Ez ∈ [Φ(250 pc),Φ(800 pc)]. The plus sign marks the origin of the (z, w)-plane.
Current usage metrics show cumulative count of Article Views (full-text article views including HTML views, PDF and ePub downloads, according to the available data) and Abstracts Views on Vision4Press platform.
Data correspond to usage on the plateform after 2015. The current usage metrics is available 48-96 hours after online publication and is updated daily on week days.
Initial download of the metrics may take a while.