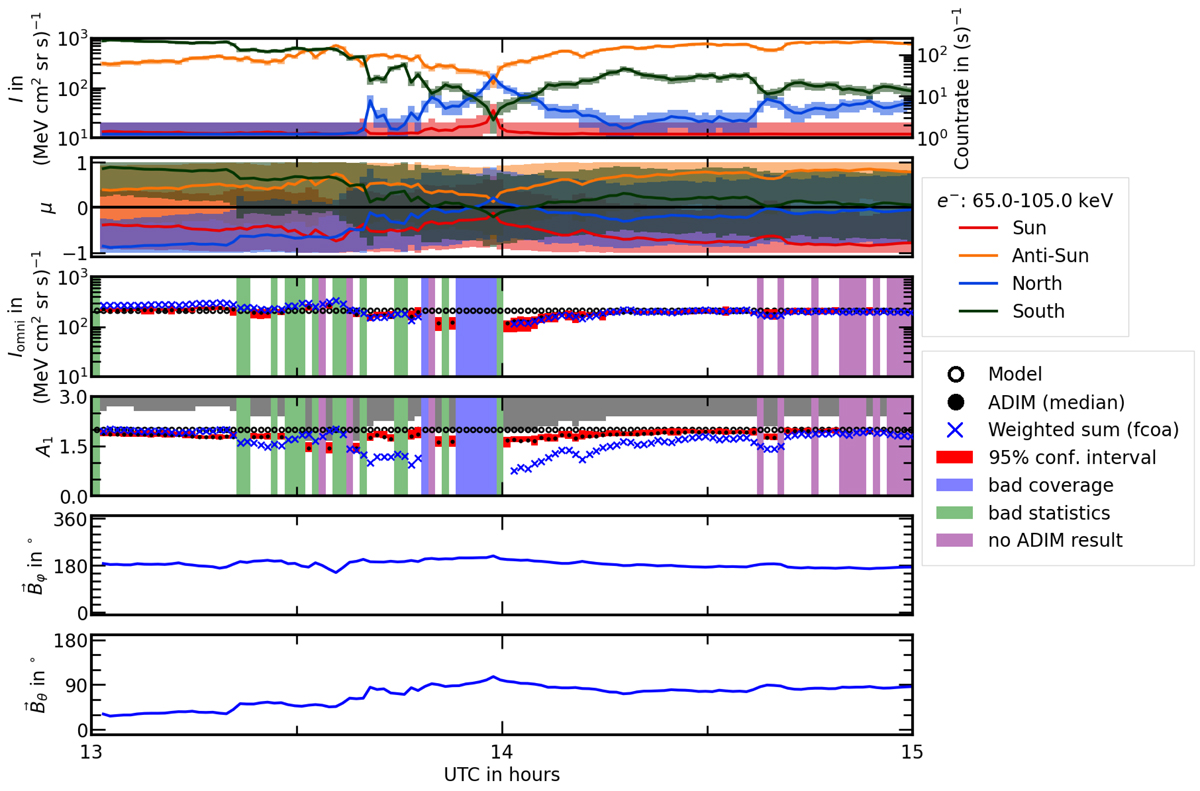
Fig. C.1.
Download original image
First-principle validity check of ADIM. From top to bottom, hybrid particle flux observation, nominal μ-value (solid lines) and extent of averaged μ-response (shaded area), anisotropy determination comparison, azimuth and zenith angle of the in situ magnetic field vector (RTN coordinates). In the anisotropy panel, the black dots and red bars represent the result of ADIM applied to the hybrid observation, the black circles represent the well-known anisotropy value of a synthetic PAD, and the blue crosses represent the anisotropy obtained by a previous anisotropy determination method. The green, blue, and purple bars mark time periods where ADIM did not yield a result. The gray shaded areas in the anisotropy panel indicate anisotropy values which cannot be obtained by ADIM.
Current usage metrics show cumulative count of Article Views (full-text article views including HTML views, PDF and ePub downloads, according to the available data) and Abstracts Views on Vision4Press platform.
Data correspond to usage on the plateform after 2015. The current usage metrics is available 48-96 hours after online publication and is updated daily on week days.
Initial download of the metrics may take a while.