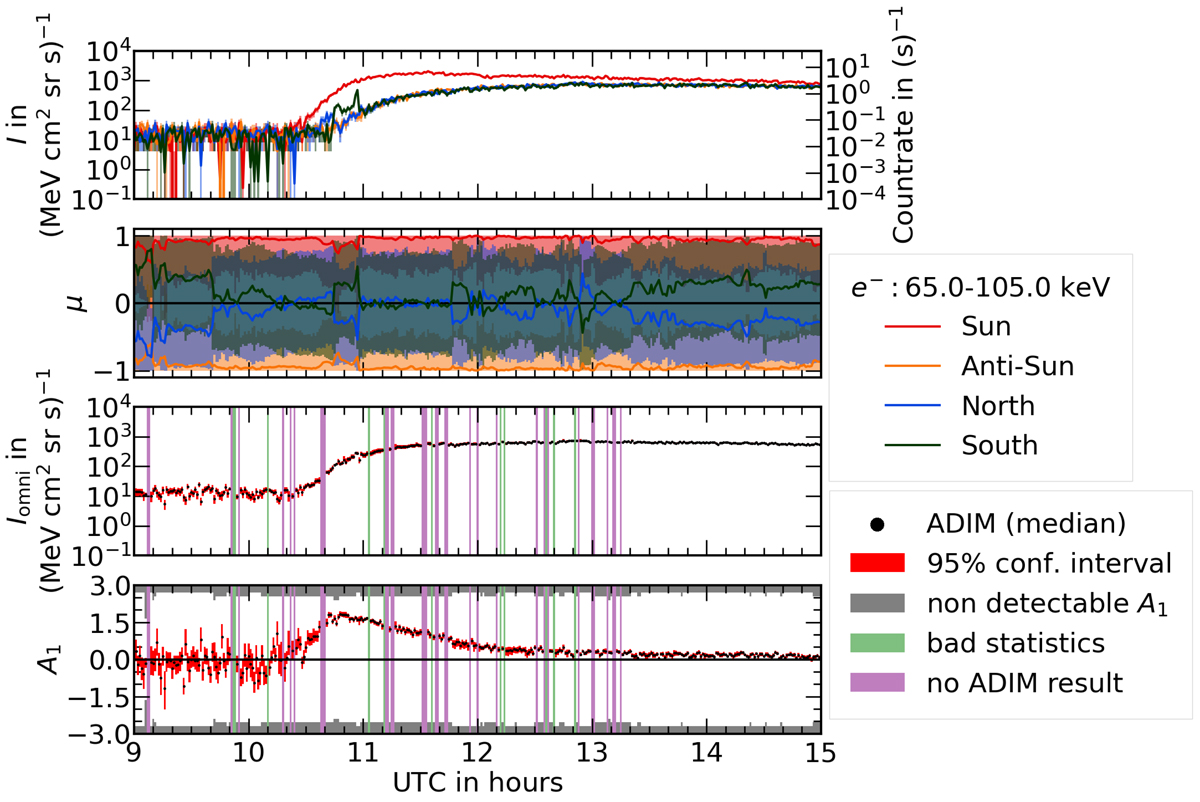
Fig. 6.
Download original image
ADIM data product for the omnidirectional particle flux and anisotropy for a solar electron event observed by SEPT on board STEREO B on 14 August, 2010. From top to bottom: differential directional particle flux including estimated uncertainty ranges as shaded areas that are barely visible because of the large extent of the logarithmic y-axis, nominal μ-value (solid lines) and extent of μ-response (shaded area), omnidirectional particle flux, and anisotropy. In the panels for the omnidirectional flux and anisotropy, the black dots represent the median value of the respective distributions determined by ADIM. The red bars indicate the corresponding uncertainty ranges that are obtained by applying 95% confidence intervals. The green and purple bars mark time-periods where ADIM did not yield a result (we give further details in Sect. 8). The gray shaded areas in the anisotropy panel indicate anisotropy values which cannot be obtained by ADIM.
Current usage metrics show cumulative count of Article Views (full-text article views including HTML views, PDF and ePub downloads, according to the available data) and Abstracts Views on Vision4Press platform.
Data correspond to usage on the plateform after 2015. The current usage metrics is available 48-96 hours after online publication and is updated daily on week days.
Initial download of the metrics may take a while.