Fig. 5.
Download original image
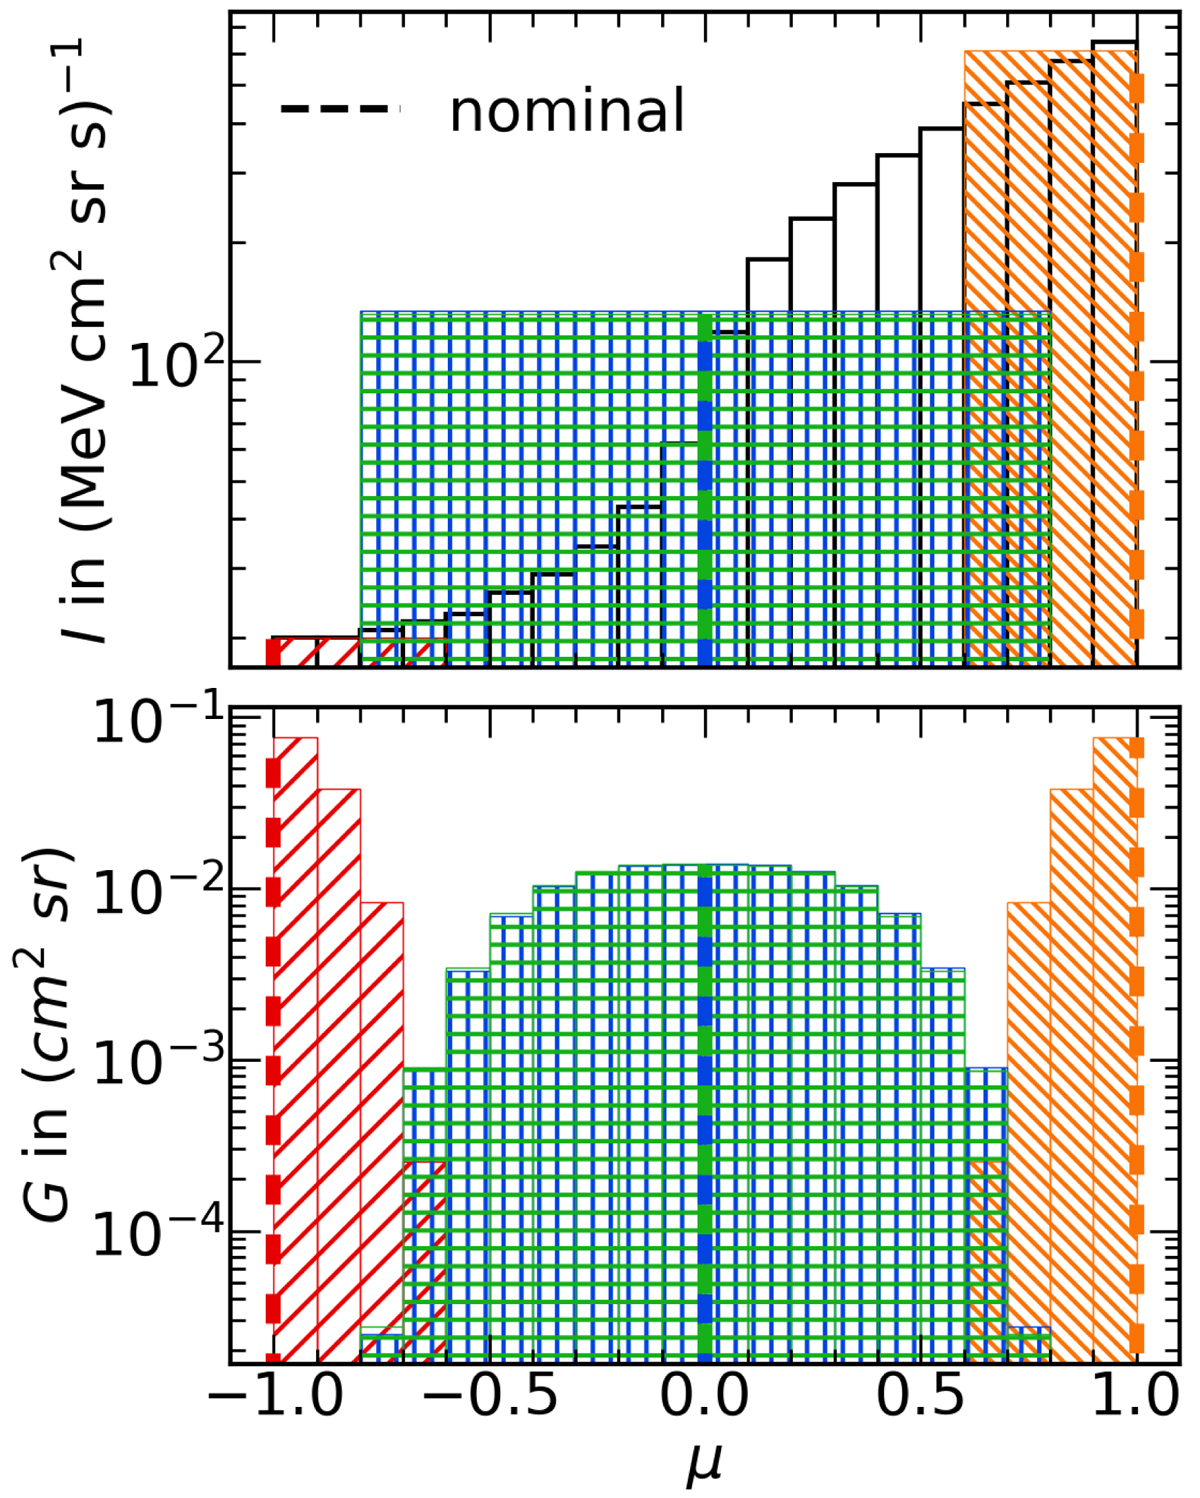
Reproducing the PAD measurement process. Bottom: directional response function in μ-space in accordance with Fig. 4b. Top: by folding an anisotropic PAD of SEPs (black edged histogram) and the μ-response shown in the bottom panel, we can reproduce the measurement of the instrument, which is given by the height of the colored boxes. The colored dashed lines represent the respective nominal μ-values.
Current usage metrics show cumulative count of Article Views (full-text article views including HTML views, PDF and ePub downloads, according to the available data) and Abstracts Views on Vision4Press platform.
Data correspond to usage on the plateform after 2015. The current usage metrics is available 48-96 hours after online publication and is updated daily on week days.
Initial download of the metrics may take a while.