Fig. 7
Download original image
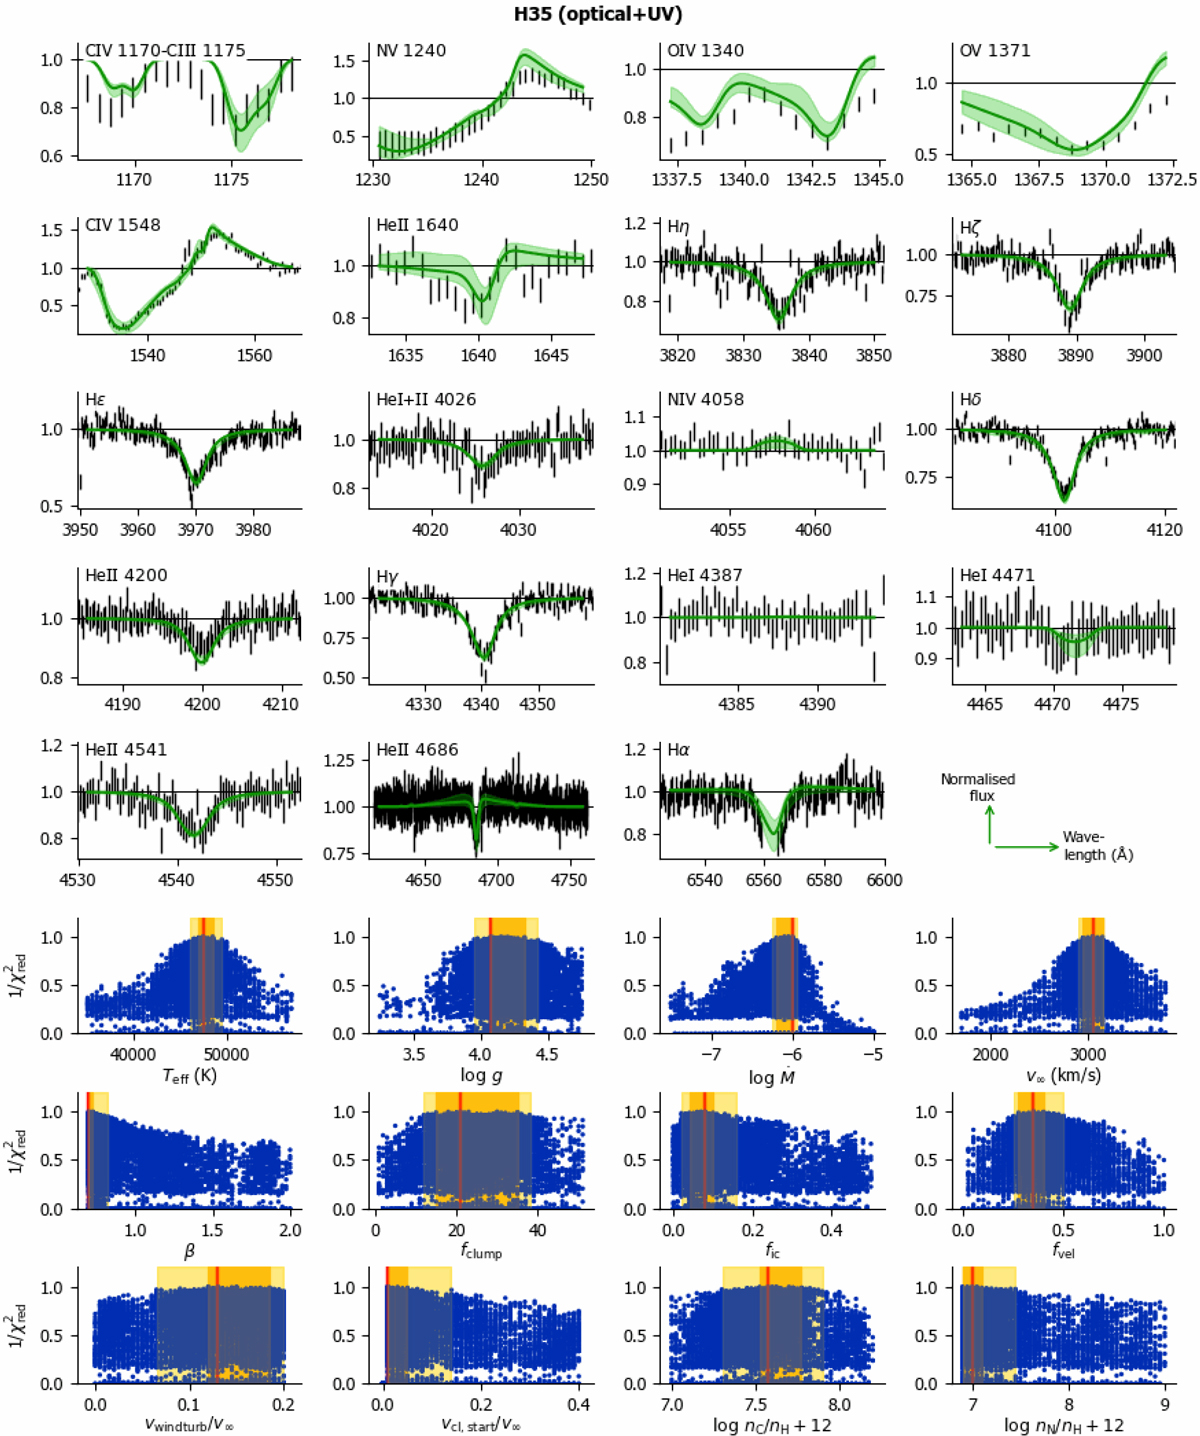
Kiwi-GA output summary for the optical + UV run of H35 (60 generations). The top of the figure shows the line profiles that were considered in the fit. For each spectral line we show the observed spectrum (black bars), the best fit model (green solid line), and the family of best fitting models, that is, the region spanned by all models in the 2σ confidence interval (light green shaded area). The bottom of the figure shows for each free parameter the goodness-of-fit (expressed as 1 /![]() ) of each model of the run represented by a dark blue dot). The position of the best model, as well as the 1σ and 2σ error regions (dark and light shaded yellow, respectively) are indicated. Output summaries for the other runs can be found on zenodo (https://zenodo.org/record/6353513).
) of each model of the run represented by a dark blue dot). The position of the best model, as well as the 1σ and 2σ error regions (dark and light shaded yellow, respectively) are indicated. Output summaries for the other runs can be found on zenodo (https://zenodo.org/record/6353513).
Current usage metrics show cumulative count of Article Views (full-text article views including HTML views, PDF and ePub downloads, according to the available data) and Abstracts Views on Vision4Press platform.
Data correspond to usage on the plateform after 2015. The current usage metrics is available 48-96 hours after online publication and is updated daily on week days.
Initial download of the metrics may take a while.