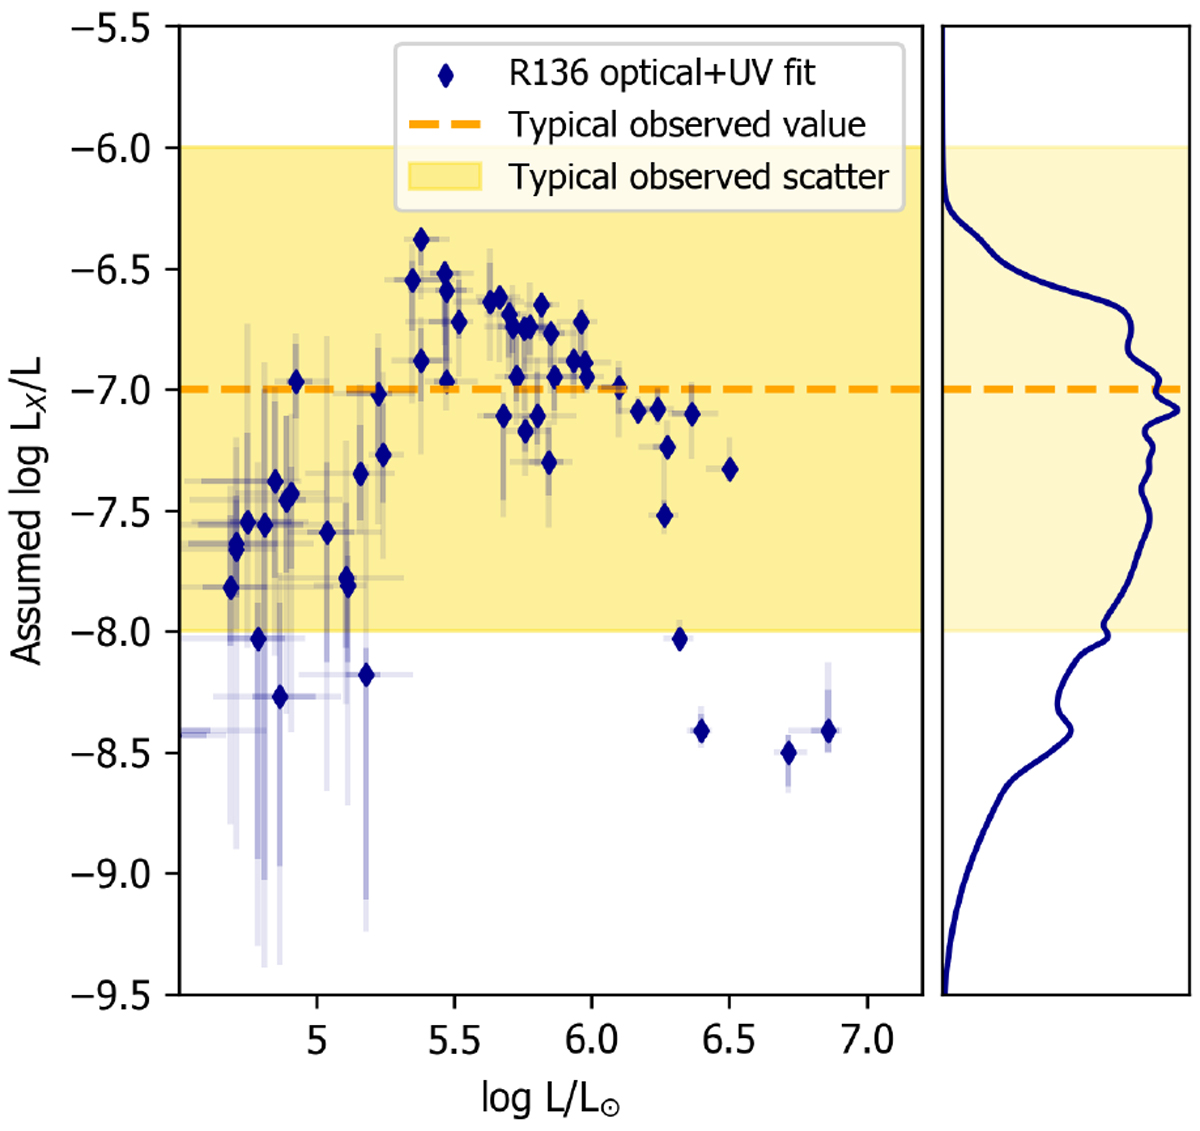
Fig. G.1
Download original image
Left: LX/L against L of the our best fitting models (dark blue diamonds with 2σ error bars). Right: Distribution of the LX/L values from our best fitting models. We indicate the typical observed value of LX/L (orange dashed line) and the typical scatter around this value (yellow band). We stress that the X-ray luminosity LX/L is not a free parameter in our fitting and the LX/L values shown here do not represent the actual X-ray flux of the given stars: this plot serves solely as a check on our assumptions (see text).
Current usage metrics show cumulative count of Article Views (full-text article views including HTML views, PDF and ePub downloads, according to the available data) and Abstracts Views on Vision4Press platform.
Data correspond to usage on the plateform after 2015. The current usage metrics is available 48-96 hours after online publication and is updated daily on week days.
Initial download of the metrics may take a while.