Fig. E.3
Download original image
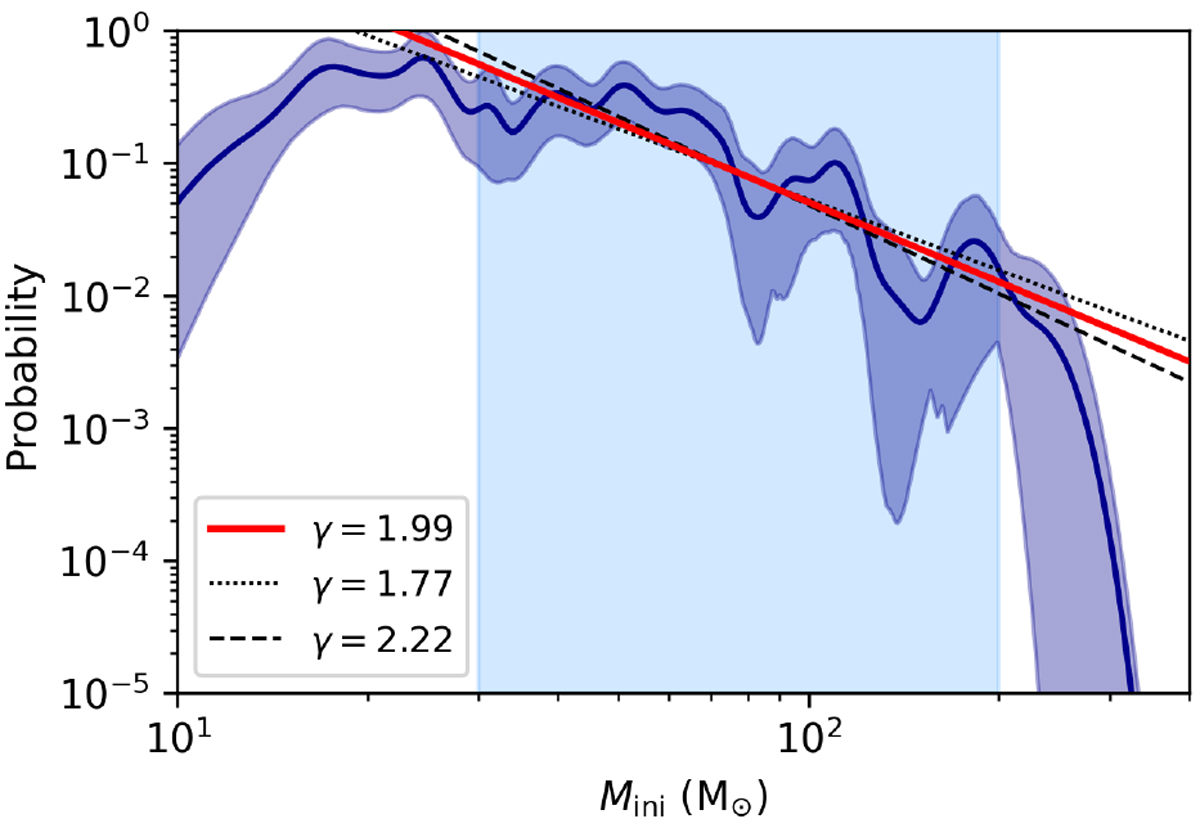
Distribution of initial masses of stars in the core of R136, as found using BONNSAI. The dark blue solid line and the shaded area around it are the observed distribution and bootstrapped 2σ uncertainties. Red solid line is the best power law fit over the region 30–200M⊙ (light blue background), black dashed and dotted line represent 2σ uncertainty on the slope.
Current usage metrics show cumulative count of Article Views (full-text article views including HTML views, PDF and ePub downloads, according to the available data) and Abstracts Views on Vision4Press platform.
Data correspond to usage on the plateform after 2015. The current usage metrics is available 48-96 hours after online publication and is updated daily on week days.
Initial download of the metrics may take a while.