Fig. 3
Download original image
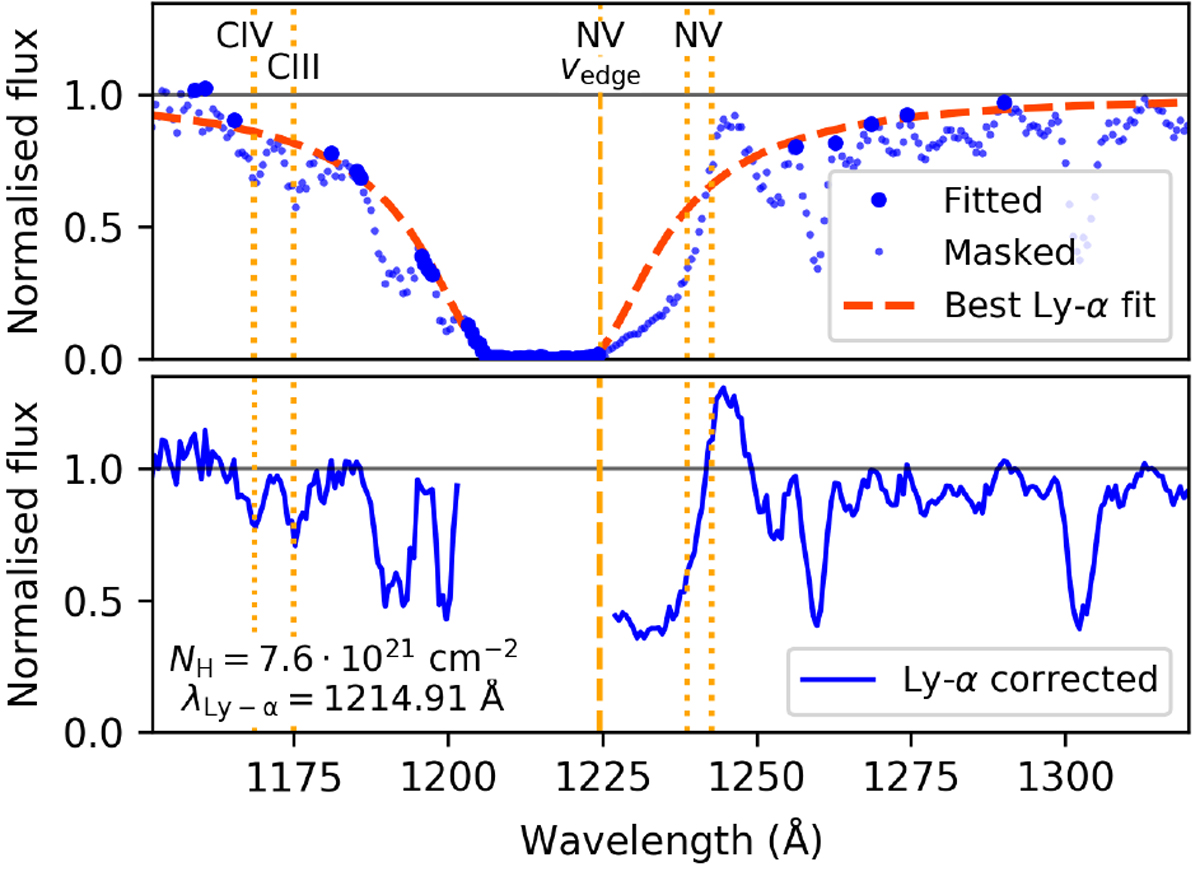
Ly-α fitting procedure for H35. Upper panel: original data (blue: flux points indicated with a large dot are considered in the fit, small ones are not) and the best fit Ly-α profile (orange dashed line). Lower panel: Ly-α corrected flux and the values of NH and λLy-α used for the correction. Indicated with vertical lines are the rest wavelengths of transitions of diagnostic lines (yellow dotted) and the position of the edge of the N v λ1240 line (yellow dashed).
Current usage metrics show cumulative count of Article Views (full-text article views including HTML views, PDF and ePub downloads, according to the available data) and Abstracts Views on Vision4Press platform.
Data correspond to usage on the plateform after 2015. The current usage metrics is available 48-96 hours after online publication and is updated daily on week days.
Initial download of the metrics may take a while.