Fig. D.2
Download original image
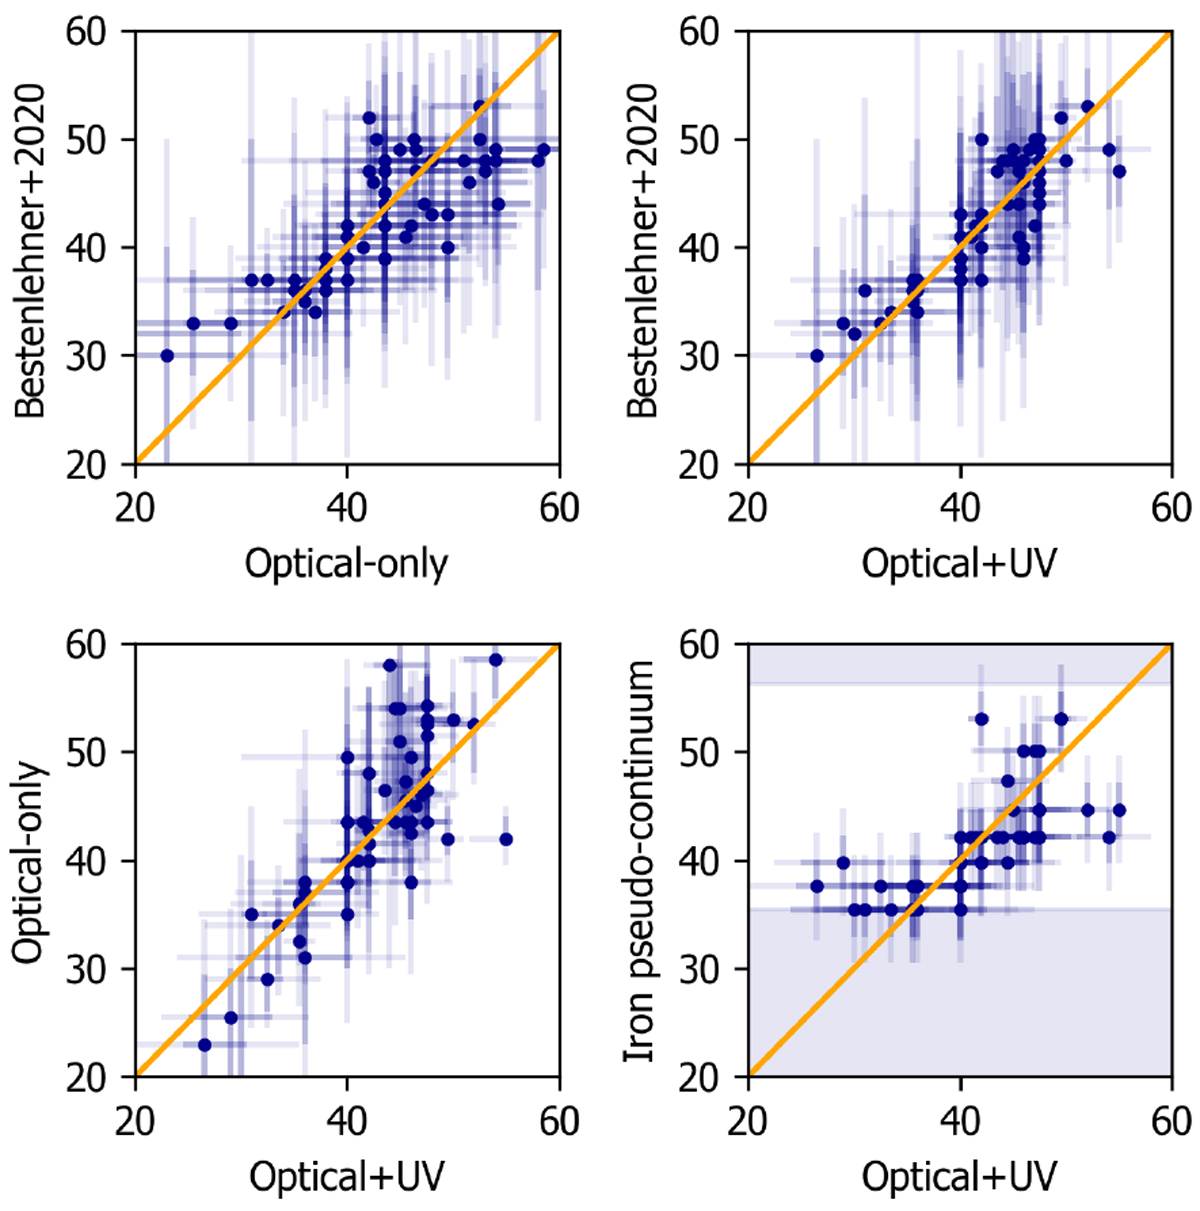
Comparison of different temperature analyses in units of 1000 K. Top: the optical-only analysis of Bestenlehner et al. (2020) against our optical-only (left) and our optical + UV analysis (right). Bottom: our optical-only (left) and our iron pseudo-continuum analysis (right) against our optical + UV analysis. The shaded are in the bottom right plot indicates the region that is not covered by the cmfgen grid that we used (Bestenlehner et al. 2014).
Current usage metrics show cumulative count of Article Views (full-text article views including HTML views, PDF and ePub downloads, according to the available data) and Abstracts Views on Vision4Press platform.
Data correspond to usage on the plateform after 2015. The current usage metrics is available 48-96 hours after online publication and is updated daily on week days.
Initial download of the metrics may take a while.