Fig. B.4
Download original image
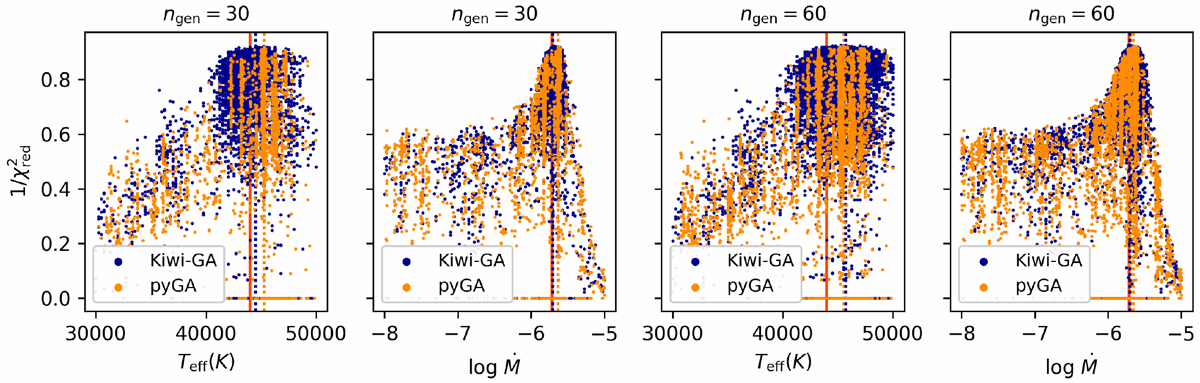
Comparison of the fitness distributions of Teff and log ![]() of two genetic algorithm runs. The dark blue points show the models of a KIWI-GA run, the yellow points the models of a pyga run. Setup of the runs was identical: both runs had the same data (Fastwind model with simulated S/N of 30), parameter space, number of individuals, and number of generations. The left two plots show the run states after 30 generations, the right two plots after 60 generations. The ‘true values’, that is, the value of the model used for simulating the data, is indicated with a red line. Dark blue and yellow dotted lines indicate the best fit models.
of two genetic algorithm runs. The dark blue points show the models of a KIWI-GA run, the yellow points the models of a pyga run. Setup of the runs was identical: both runs had the same data (Fastwind model with simulated S/N of 30), parameter space, number of individuals, and number of generations. The left two plots show the run states after 30 generations, the right two plots after 60 generations. The ‘true values’, that is, the value of the model used for simulating the data, is indicated with a red line. Dark blue and yellow dotted lines indicate the best fit models.
Current usage metrics show cumulative count of Article Views (full-text article views including HTML views, PDF and ePub downloads, according to the available data) and Abstracts Views on Vision4Press platform.
Data correspond to usage on the plateform after 2015. The current usage metrics is available 48-96 hours after online publication and is updated daily on week days.
Initial download of the metrics may take a while.