Fig. B.3
Download original image
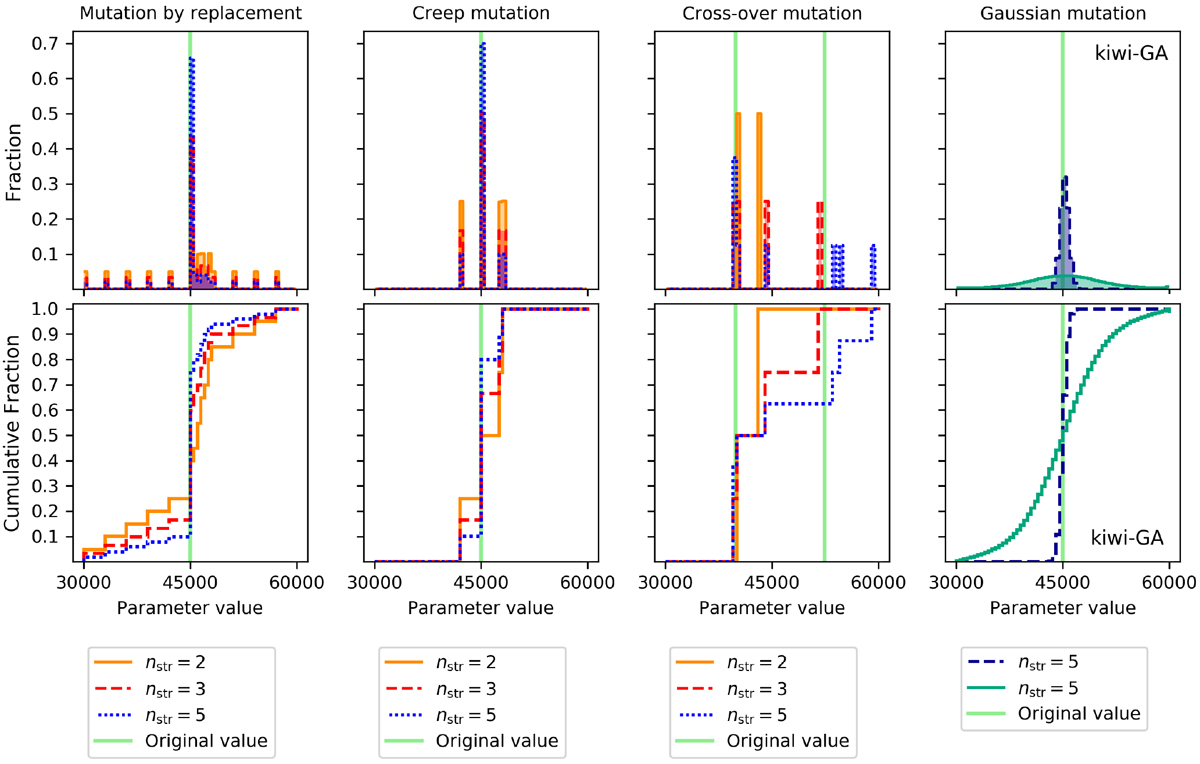
Distribution (top panels) and cumulative distribution (bottom panels) of mutation sizes of different schemes. The panels in the first three columns on the left show the behaviour of different types of mutation that result from modifying strings that represent the parameters in three different ways: by replacing one string digit by a random other digit (mutation by replacement), by increasing or decreasing the value of one string digit with 1 (creep mutation), and by changing one or more digits of a string by slicing it during the recombination process (cross-over mutation). The green vertical line indicates the original value of the parameter (in the third panels from the left this are two lines: one for each parent), in orange, red and blue the distribution of parameter values after the mutation has taken place. The different colours refer to the amount of digits that decode one parameter. The rightmost panels show the behaviour when the mutation size is described by a Gaussian distribution, as is the case in KIWI-GA.
Current usage metrics show cumulative count of Article Views (full-text article views including HTML views, PDF and ePub downloads, according to the available data) and Abstracts Views on Vision4Press platform.
Data correspond to usage on the plateform after 2015. The current usage metrics is available 48-96 hours after online publication and is updated daily on week days.
Initial download of the metrics may take a while.