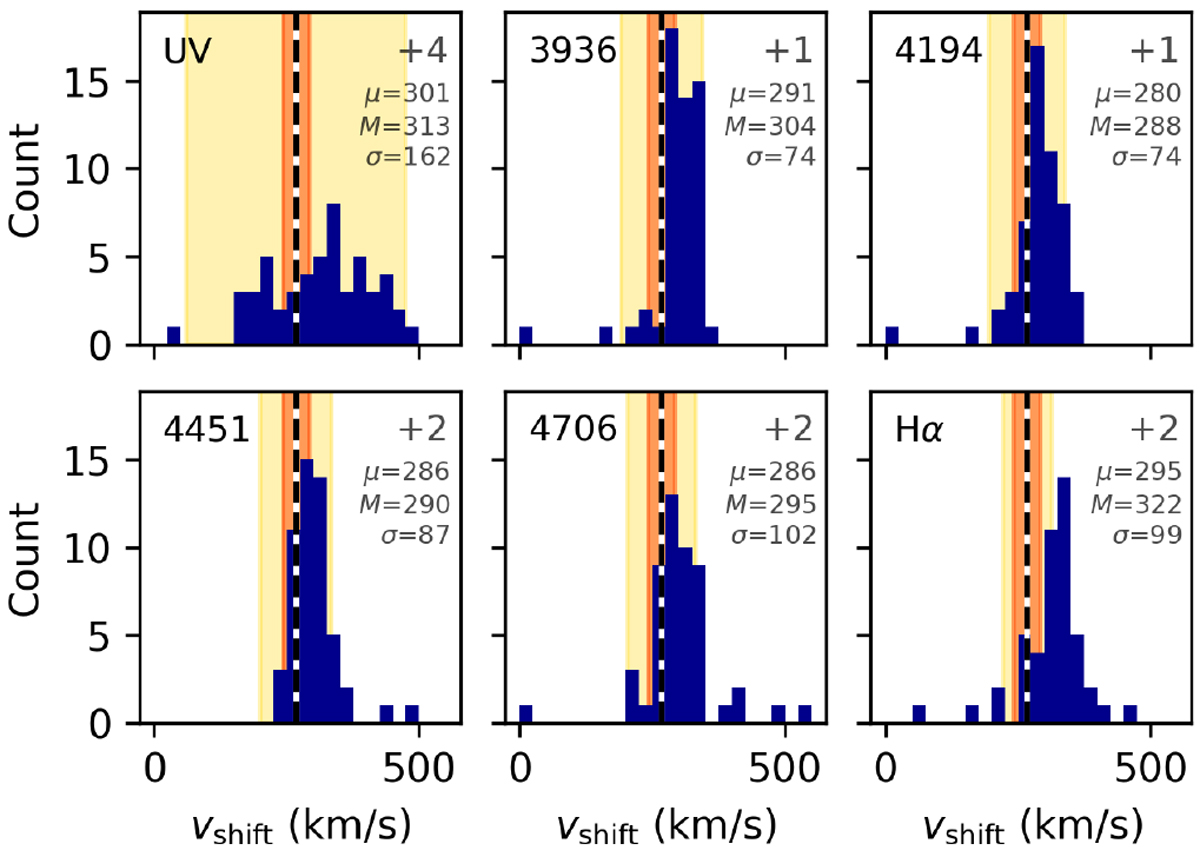
Fig. B.2
Download original image
Distribution of measured wavelength corrections υshift in km s−1, for each grating (dark blue). We indicate the mean R136 velocity of 267.7 km s−1 as measured by Hénault-Brunet et al. (2012, black dashed lines), together with the non-binary-corrected velocity dispersion of σ = ±25 km s−1 (orange-red shaded), as well as a velocity range corresponding ±2 pixels around the R136 mean (yellow shaded). The numbers in the upper right corner of each plot denote the amount of stars that fall out of the plotted velocity range. Below that, we show the inferred mean µ, median M and standard deviation σ of each grating (all in km s−1).
Current usage metrics show cumulative count of Article Views (full-text article views including HTML views, PDF and ePub downloads, according to the available data) and Abstracts Views on Vision4Press platform.
Data correspond to usage on the plateform after 2015. The current usage metrics is available 48-96 hours after online publication and is updated daily on week days.
Initial download of the metrics may take a while.