Fig. 22
Download original image
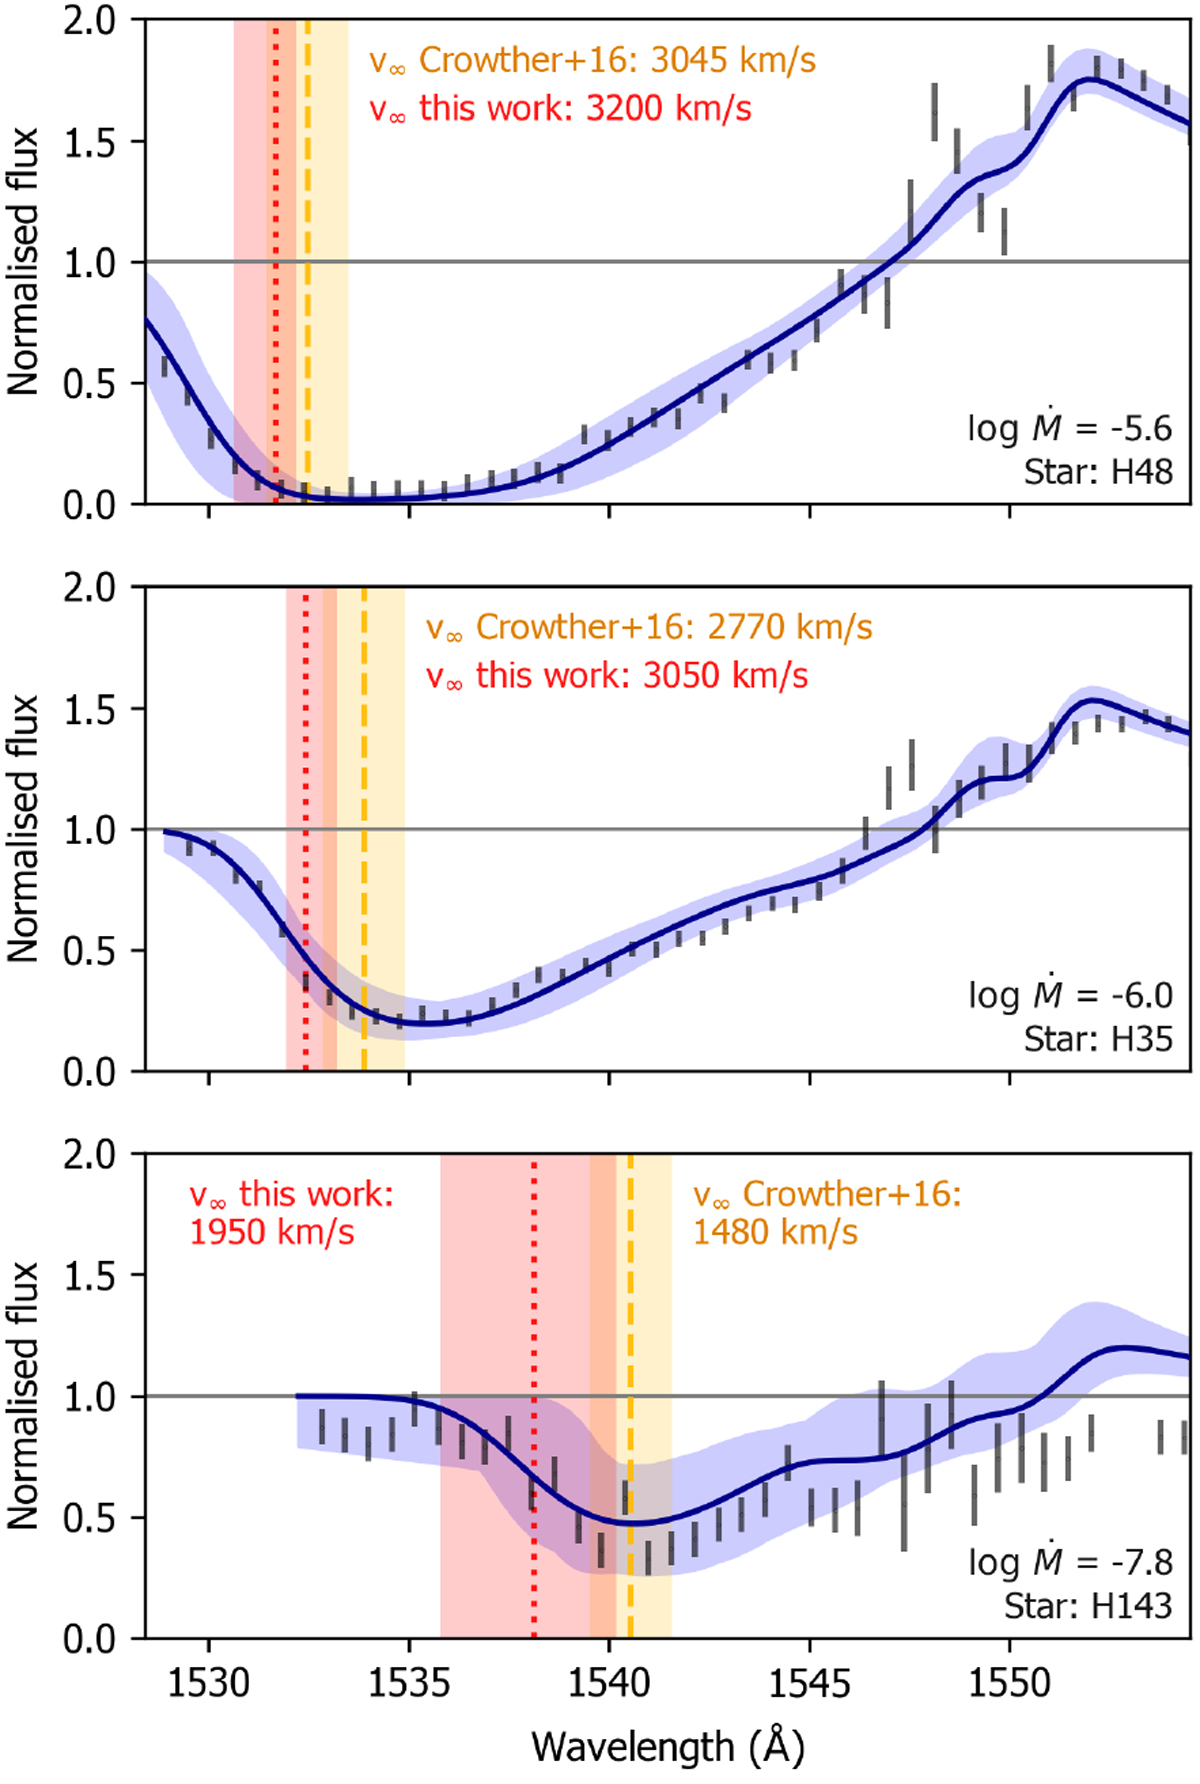
Line profiles of C iv λλ1548–1551 and the best fit models (2σ) compared to the values of υ∞ determined by spectral fitting (this work, red dotted line) and those of Crowther et al. (2016, yellow dashed line). The shaded regions indicate the 2σ errors on the derived υ∞. We used the blue transition of the doublet (λ = 1548.19Å) for indicating velocities. We show profiles with different C iv λλ1548–1551 appearances: strong and saturated (top), strong but not saturated (middle) and weak (bottom). In all cases υ∞ from spectral modelling lies bluewards of that of Crowther et al. (2016). See also Fig. 21.
Current usage metrics show cumulative count of Article Views (full-text article views including HTML views, PDF and ePub downloads, according to the available data) and Abstracts Views on Vision4Press platform.
Data correspond to usage on the plateform after 2015. The current usage metrics is available 48-96 hours after online publication and is updated daily on week days.
Initial download of the metrics may take a while.