Fig. 21
Download original image
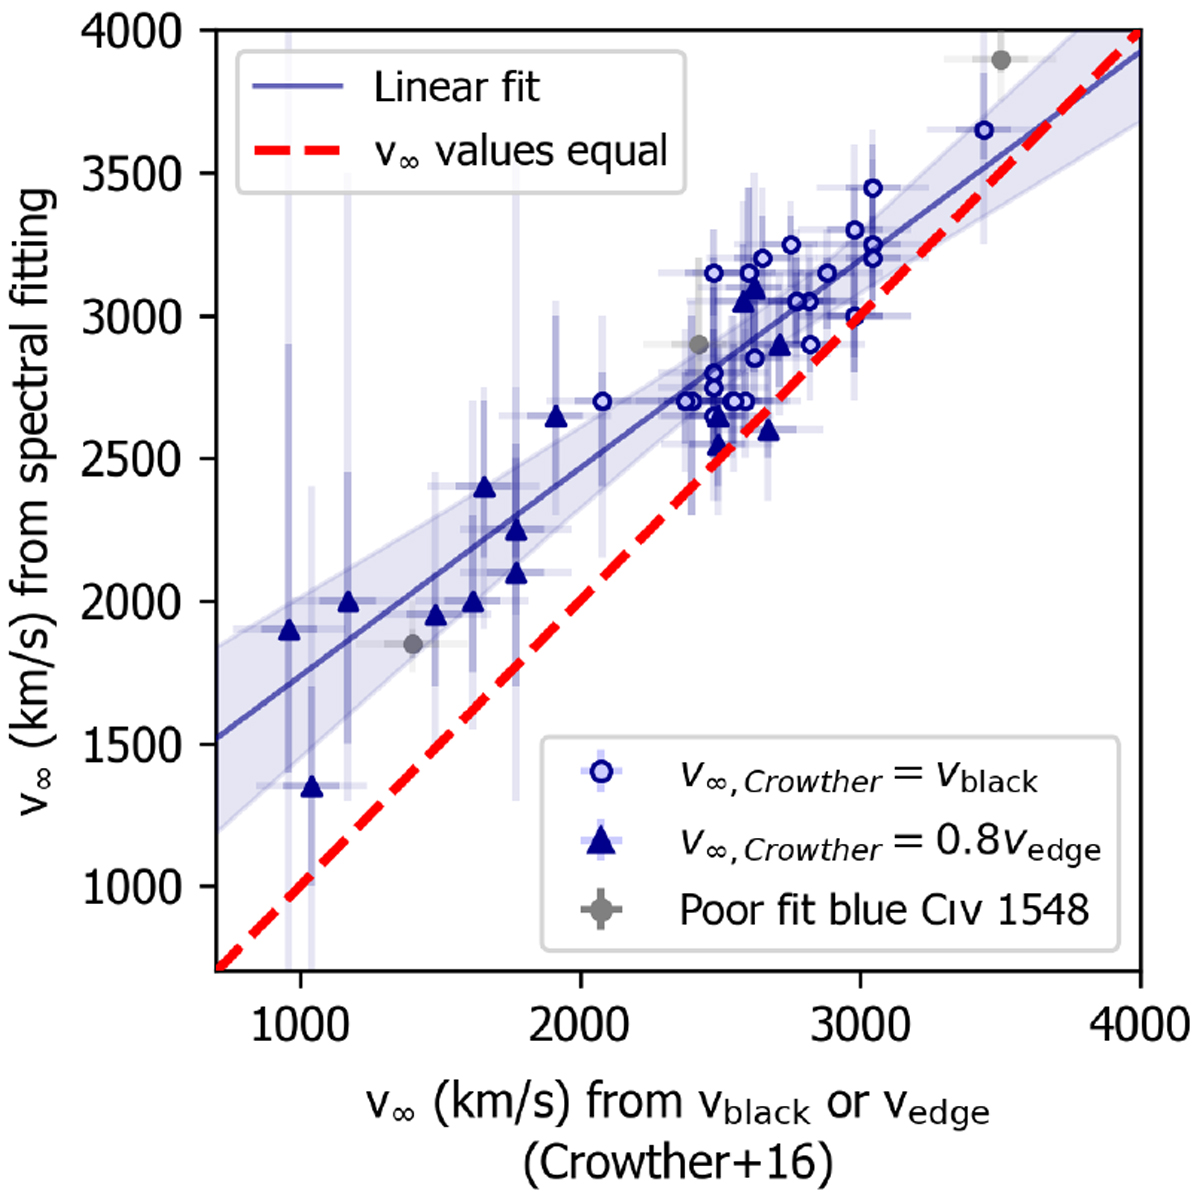
Comparison of terminal velocities υ∞ determined by spectral fitting (this work) to those determined by locating υblack (Crowther et al. 2016). Circles indicate sources for which Crowther et al. (2016) estimated υ∞ based on υblack, solid triangles indicate sources for which they used 0.8υedge. Grey symbols indicate sources for which we could not obtained a good fit to the C iv λλ1548–1551 profile. The thick red dashed line shows where the two methods agree, while the blue solid line shows a linear fit through the data. See also Fig. 22.
Current usage metrics show cumulative count of Article Views (full-text article views including HTML views, PDF and ePub downloads, according to the available data) and Abstracts Views on Vision4Press platform.
Data correspond to usage on the plateform after 2015. The current usage metrics is available 48-96 hours after online publication and is updated daily on week days.
Initial download of the metrics may take a while.