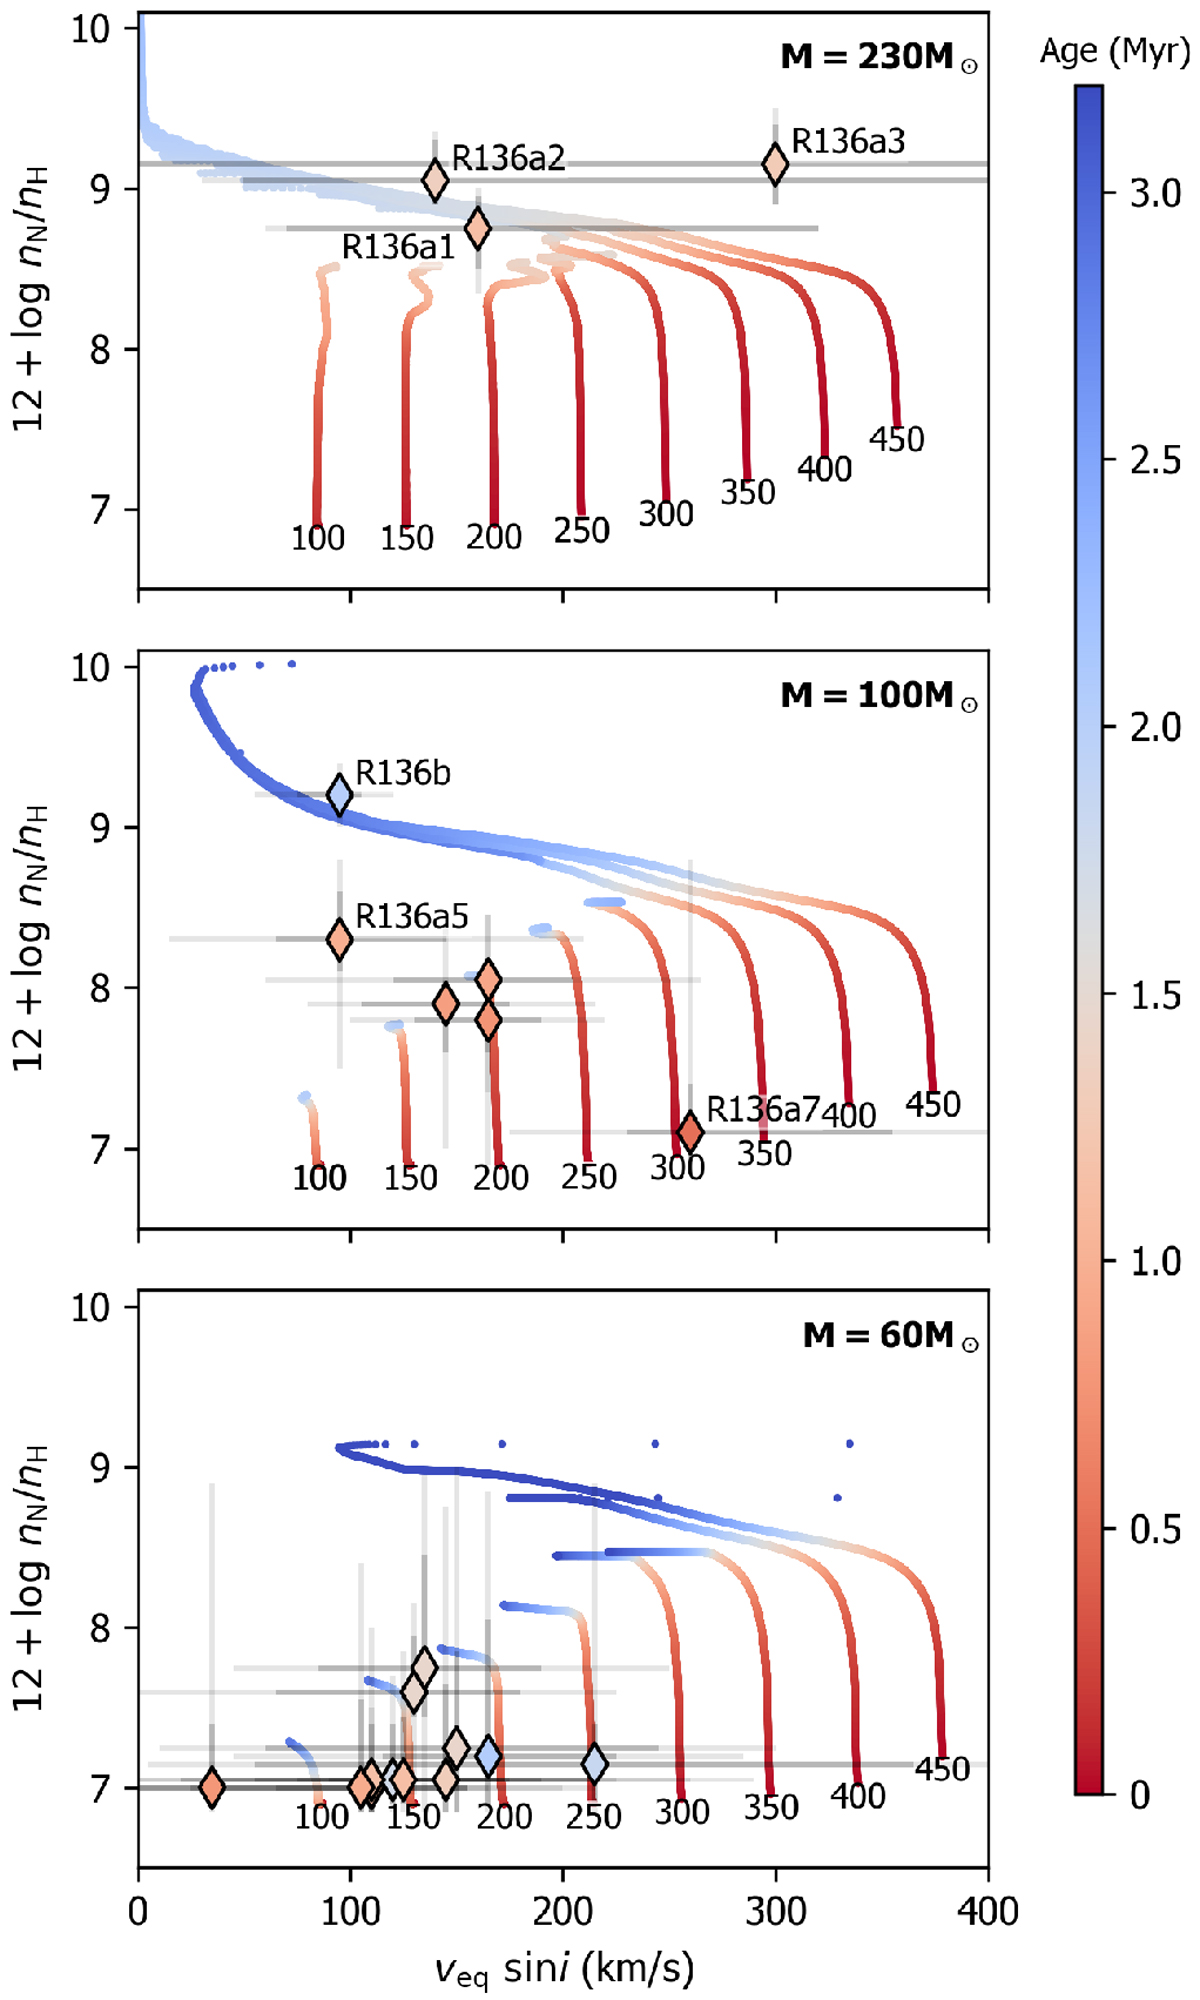
Fig. 20
Download original image
Hunter diagrams, showing stellar age (red to blue colour bar) as a function of rotation and nitrogen surface abundance. Evolutionary tracks are taken from Köhler et al. (2015) and depict the evolution of stars with an initial mass of 230 M⊙ (top), 100 M⊙ (centre), and 60 M⊙ (bottom) with a range of initial rotation rates. We note that the theoretical rotation rates are scaled by π/4 to correct for the average projection angle, and that the tracks are cut off at Teff < 29 000 K. The diamond markers indicate the observed positions of sources in the respective mass-regimes, where their colour maps to age via the same coding as the tracks. For a discussion on the error bars on the observed rotation rates of the WNh stars, see text.
Current usage metrics show cumulative count of Article Views (full-text article views including HTML views, PDF and ePub downloads, according to the available data) and Abstracts Views on Vision4Press platform.
Data correspond to usage on the plateform after 2015. The current usage metrics is available 48-96 hours after online publication and is updated daily on week days.
Initial download of the metrics may take a while.