Fig. 2
Download original image
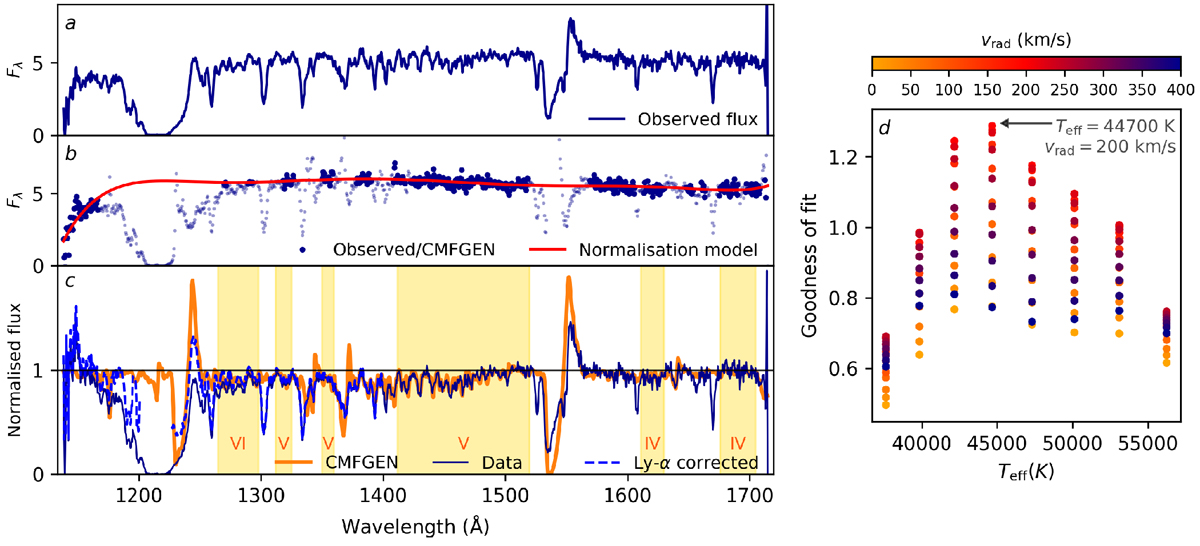
UV normalisation and Teff fitting procedure for H35. Left panels: (a) the observed flux in units of 10−14 ergs cm−2 s−1 Å−1, (b) the observed flux divided by the normalised cmfgen model (dark blue points, masked points are shown semi-transparent) and a fit through the non-masked points (red solid line), and (c) the normalised spectrum (dark blue solid line), the normalised, Ly-α corrected spectrum (blue dashed line) and the cmfgen model used for obtaining the normalisation model (solid orange line). The yellow shaded areas indicate the regions used for determining the goodness of fit of the iron pseudo-continuum of the model; roman numerals indicate the dominant iron ion in each region. Right panel: for each model Teff and vrad the dimensionless goodness of fit to the normalised iron pseudo-continuum of the data (defined as the inverse of the squared sum of the difference between the normalised fluxes of the model and the data in the iron continuum). At the peak lie the Teff and vrad that give the best fit: these are the values that are used for the final normalisation shown on the left.
Current usage metrics show cumulative count of Article Views (full-text article views including HTML views, PDF and ePub downloads, according to the available data) and Abstracts Views on Vision4Press platform.
Data correspond to usage on the plateform after 2015. The current usage metrics is available 48-96 hours after online publication and is updated daily on week days.
Initial download of the metrics may take a while.