Fig. 19
Download original image
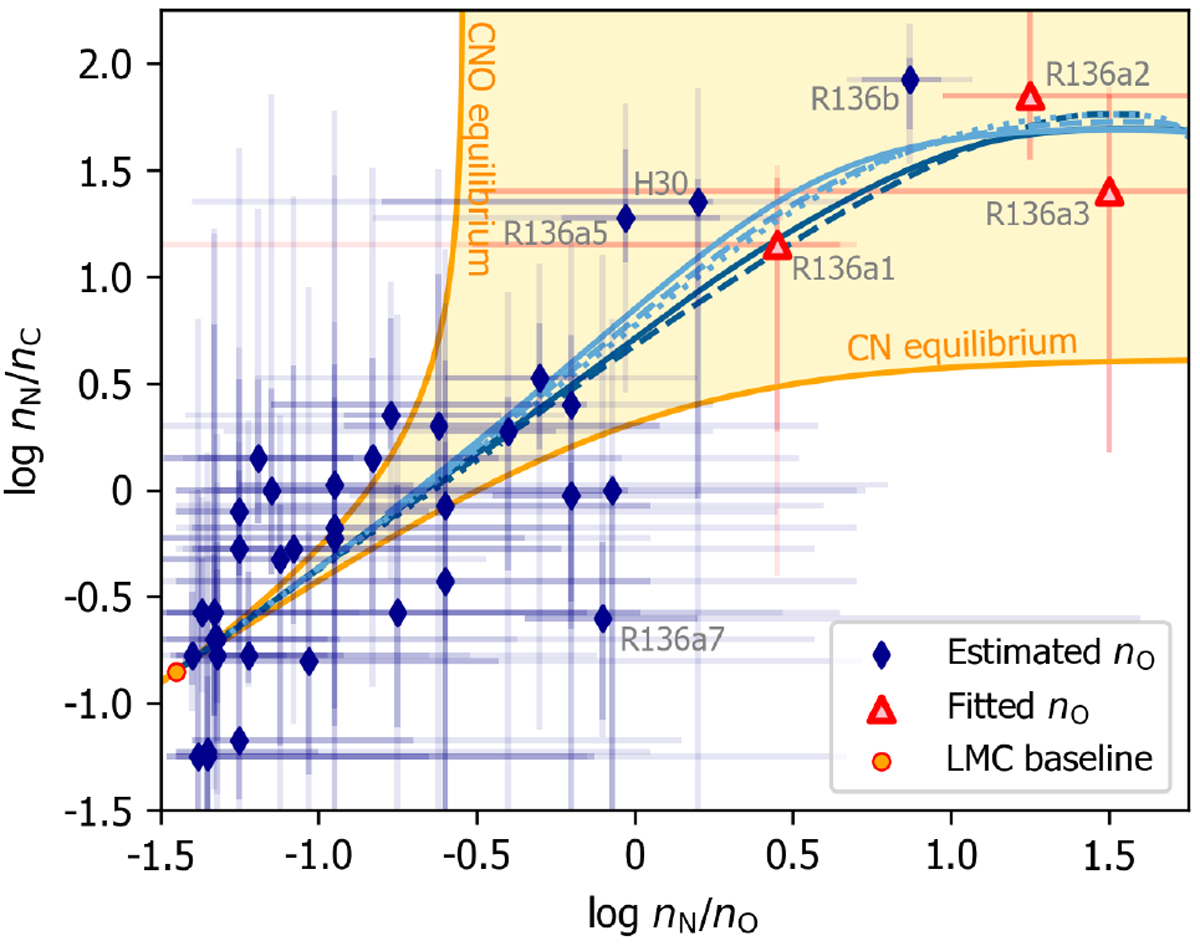
Comparison of our observed CNO-abundances to the theory of CNO processing. Only for three sources all abundances were measured (red triangles), for the rest the oxygen abundance is fixed to the LMC baseline value of nO = 8.35 (see text). The yellow shaded region marks the regime between the analytical limiting solutions (CNO- and CN-equilibrium) of Maeder et al. (2014), their Eqs. (14) and (17), respectively. Dotted, dashed and solid blue lines show evolutionary tracks of 30, 60 and 150 M⊙, respectively (Brott et al. 2011a; Köhler et al. 2015), where light and dark blues indicate models with low (~100 km s−1) and high (~500 km s−1) initial rotation velocities.
Current usage metrics show cumulative count of Article Views (full-text article views including HTML views, PDF and ePub downloads, according to the available data) and Abstracts Views on Vision4Press platform.
Data correspond to usage on the plateform after 2015. The current usage metrics is available 48-96 hours after online publication and is updated daily on week days.
Initial download of the metrics may take a while.