Fig. 17
Download original image
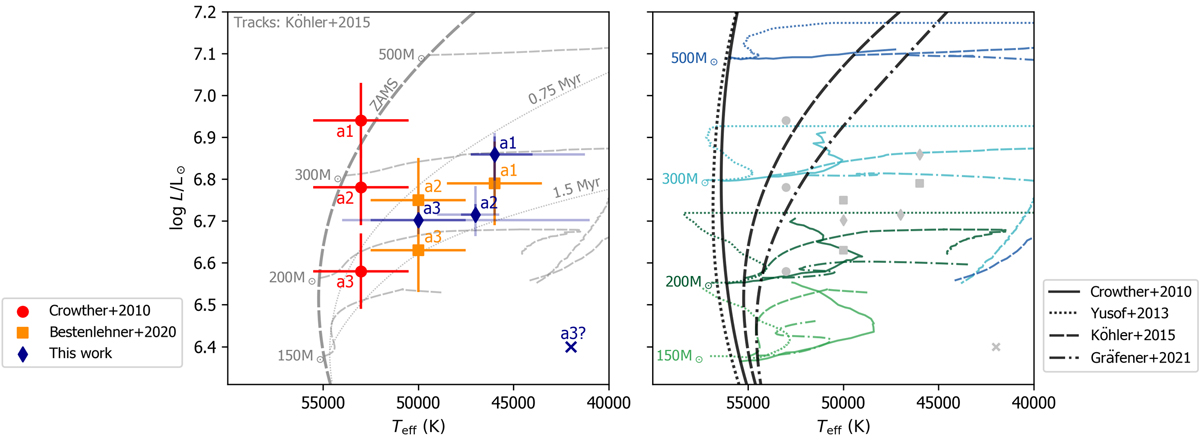
Positions of the WNh stars and evolutionary tracks in the Hertzsprung-Russell diagram. Left: temperature and luminosity of the WNh stars as found from this analysis (dark blue diamonds), as derived by Crowther et al. (2010, red circles) and as derived by Bestenlehner et al. (2020, orange squares). The cross indicates an alternative (but unlikely, see text) position for R136a3. Shown in the background is a subset of the evolutionary tracks of Köhler et al. (2015, thin grey dashed lines), on which the evolutionary masses and ages derived in this paper are based. Also shown is the corresponding Zero Age Main Sequence (ZAMS, thick grey dashed line) and the 0.75 Myr and 1.5 Myr isochrones (grey dotted) of the Köhler et al. (2015) models. Right: comparison of the stellar evolution models of Crowther et al. (2010, solid lines), Yusof et al. (2013, dotted lines), Köhler et al. (2015, dashed lines) and Gräfener (2021, dashed-dotted lines). For each grid we show tracks of models with an initial mass of 150, 200, 300 and 500 M⊙ in light green, dark green, light blue and dark blue, respectively. Black thick lines denote the ZAMS positions of each grid. The notable difference in ZAMS positions of the tracks of Crowther et al. (2010), Yusof et al. (2013) on the one hand, and Köhler et al. (2015) and Gräfener (2021) on the other hand is related to their treatment of convection in the inflated envelopes of the most massive stars. For reference, the observed positions as in the left panel are also shown in the right panel (grey and without error bars). All tracks have an initial rotation veq,ini of 0.4 veq,crit, with veq,crit the critical velocity, except for those of Köhler et al. (2015), for which we show the models with veq,ini = 350 km s−1 for 150–300 M⊙ models and 300 km s−1 for the 500 M⊙ model, corresponding to veq,ini/veq,crit = 0.38 ± 0.01.
Current usage metrics show cumulative count of Article Views (full-text article views including HTML views, PDF and ePub downloads, according to the available data) and Abstracts Views on Vision4Press platform.
Data correspond to usage on the plateform after 2015. The current usage metrics is available 48-96 hours after online publication and is updated daily on week days.
Initial download of the metrics may take a while.