Fig. 16
Download original image
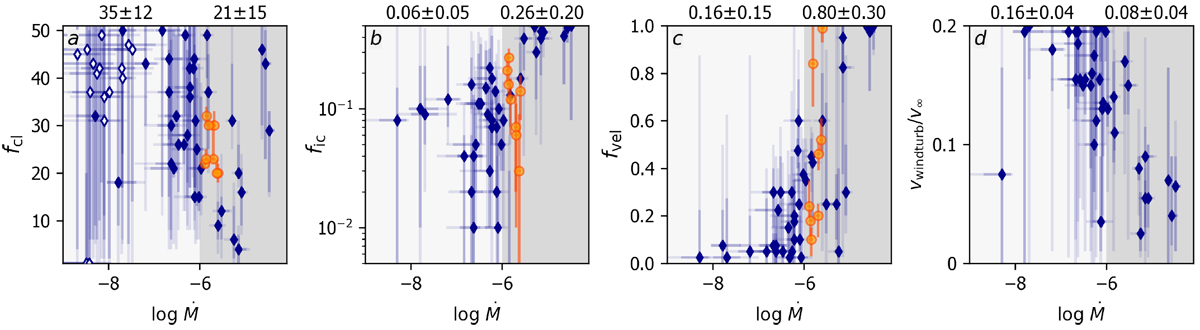
Wind structure parameters plotted against mass-loss rate of stars in R136 (blue diamonds, dark and light shaded error bars denote 1σ and 2σ uncertainties) and eight Galactic stars of the sample of Hawcroft et al. (2021, orange circles, 2σ uncertainties). The limits of the y-axis of each plot coincide with the range of values that was allowed during the fit. The panels a–d show, from left to right, the clumping factor, the interclump density contrast, the vorosity and the wind turbulence. At the top of each panel the average value of the parameter (± 1σ uncertainty) is quoted for two Ṁ regimes: low (log Ṁ < –6, light grey shaded) and high (log Ṁ > –6, dark grey shaded). In the leftmost panel, the diamonds with a white interior denote sources that are not present in the other three panels, as the fic, fvel and vwindturb values were not fitted in their optical + UV runs. No values of Hawcroft et al. (2021) are shown in the rightmost panel, as they do not fit vwindturb.
Current usage metrics show cumulative count of Article Views (full-text article views including HTML views, PDF and ePub downloads, according to the available data) and Abstracts Views on Vision4Press platform.
Data correspond to usage on the plateform after 2015. The current usage metrics is available 48-96 hours after online publication and is updated daily on week days.
Initial download of the metrics may take a while.