Fig. 15
Download original image
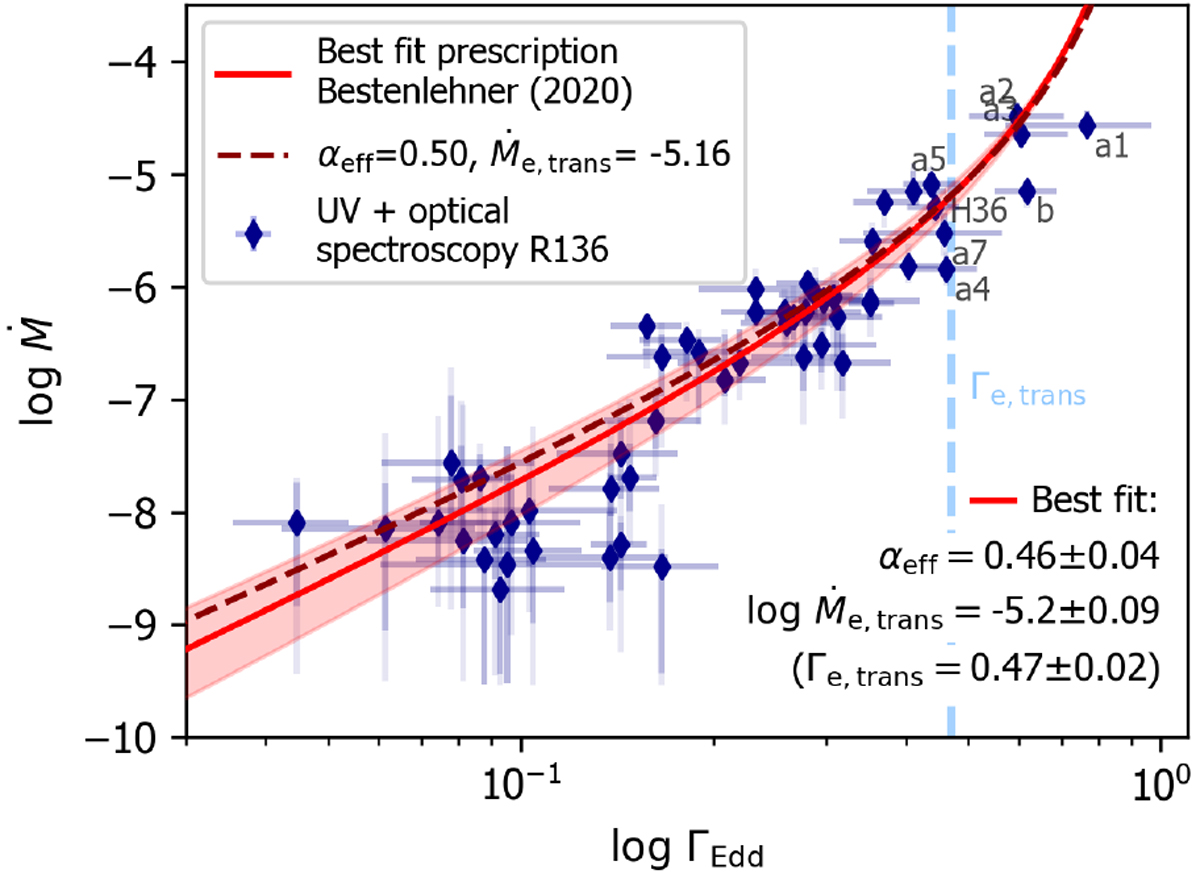
Best fit and 1σ error region that we obtain by fitting the CAK-type mass-loss prescription as described in Bestenlehner (2020, red solid line and shaded area) to our observed mass-loss rates (blue circles, dark and light error bars denote 1σ and 2σ uncertainties). The best fit values we derive are shown in the bottom right corner. For comparison we show the CAK-type prescription also for the case of αeff = 0.50, as obtained by fitting the slope of the modified wind momentum (dark red dashed line). Eight sources that lie close or above Γe,trans are labelled with their abbreviated identifications (e.g. a1 is R136a1).
Current usage metrics show cumulative count of Article Views (full-text article views including HTML views, PDF and ePub downloads, according to the available data) and Abstracts Views on Vision4Press platform.
Data correspond to usage on the plateform after 2015. The current usage metrics is available 48-96 hours after online publication and is updated daily on week days.
Initial download of the metrics may take a while.