Fig. 14
Download original image
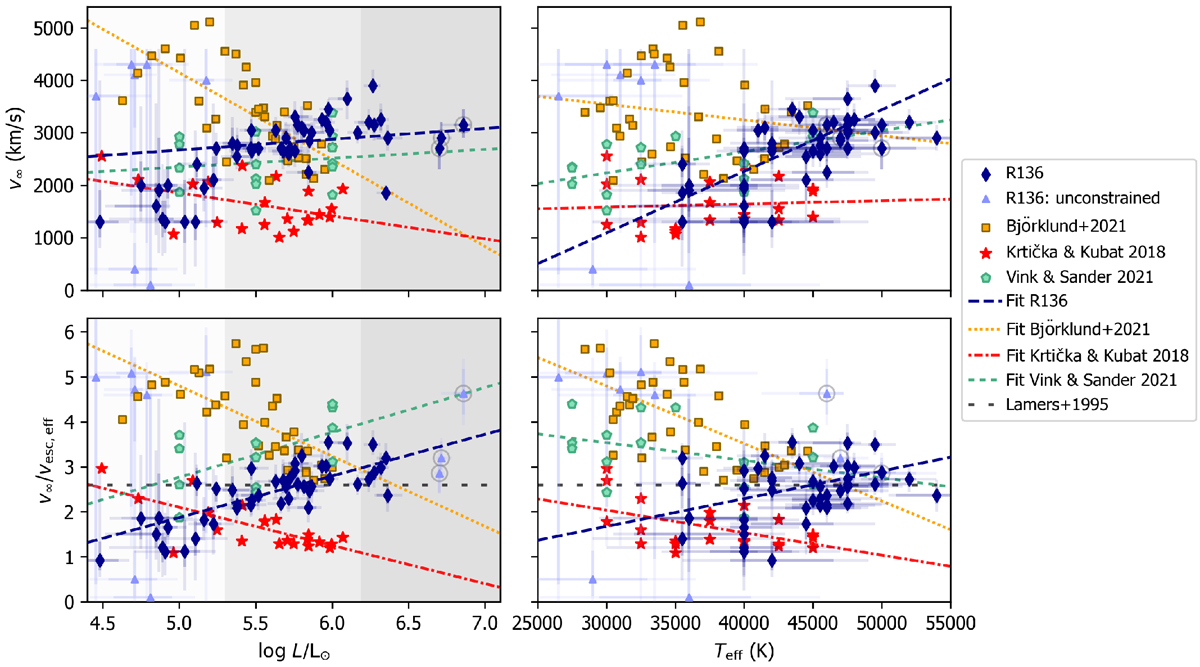
Terminal velocity v∞ (top) and the ratio v∞/vesc,eff (bottom) against log L/L⊙ (left) and Teff (right) for the R136 sample (solid dark blue diamonds) compared to predicted values (yellow squares, red stars, and green pentagons Björklund et al. 2021; Krtička & Kubát 2018 and Vink & Sander 2021, respectively). Light purple triangles denote R136 sources for which we could not derive v∞ values (see Sect. 4.3), and in the bottom plot also includes the WNh stars, where we cannot be too confident about vesc,eff. Grey circles around the points of the WNh stars allows to distinguish them from the O-type stars. Dark and light coloured error bars denote 1 and 2σ uncertainties, respectively. The lines, plotted in different styles (see legend) show linear fits to both the observed (dark blue) and predicted values (red, orange and green). In the bottom panel, the black dashed line shows the empirically derived v∞/vesc,eff = 2.6 (Lamers et al. 1995). The grey shaded regions in the luminosity plots correspond to those in Fig. 12. We note that we do not show any points of models with Teff = 35 000 K for the Vink & Sander (2021) predictions; in this regime the predicted terminal velocities largely exceed the velocity scale of this plot. The linear fit through the Vink & Sander (2021) predictions also excludes these points.
Current usage metrics show cumulative count of Article Views (full-text article views including HTML views, PDF and ePub downloads, according to the available data) and Abstracts Views on Vision4Press platform.
Data correspond to usage on the plateform after 2015. The current usage metrics is available 48-96 hours after online publication and is updated daily on week days.
Initial download of the metrics may take a while.