Fig. 12
Download original image
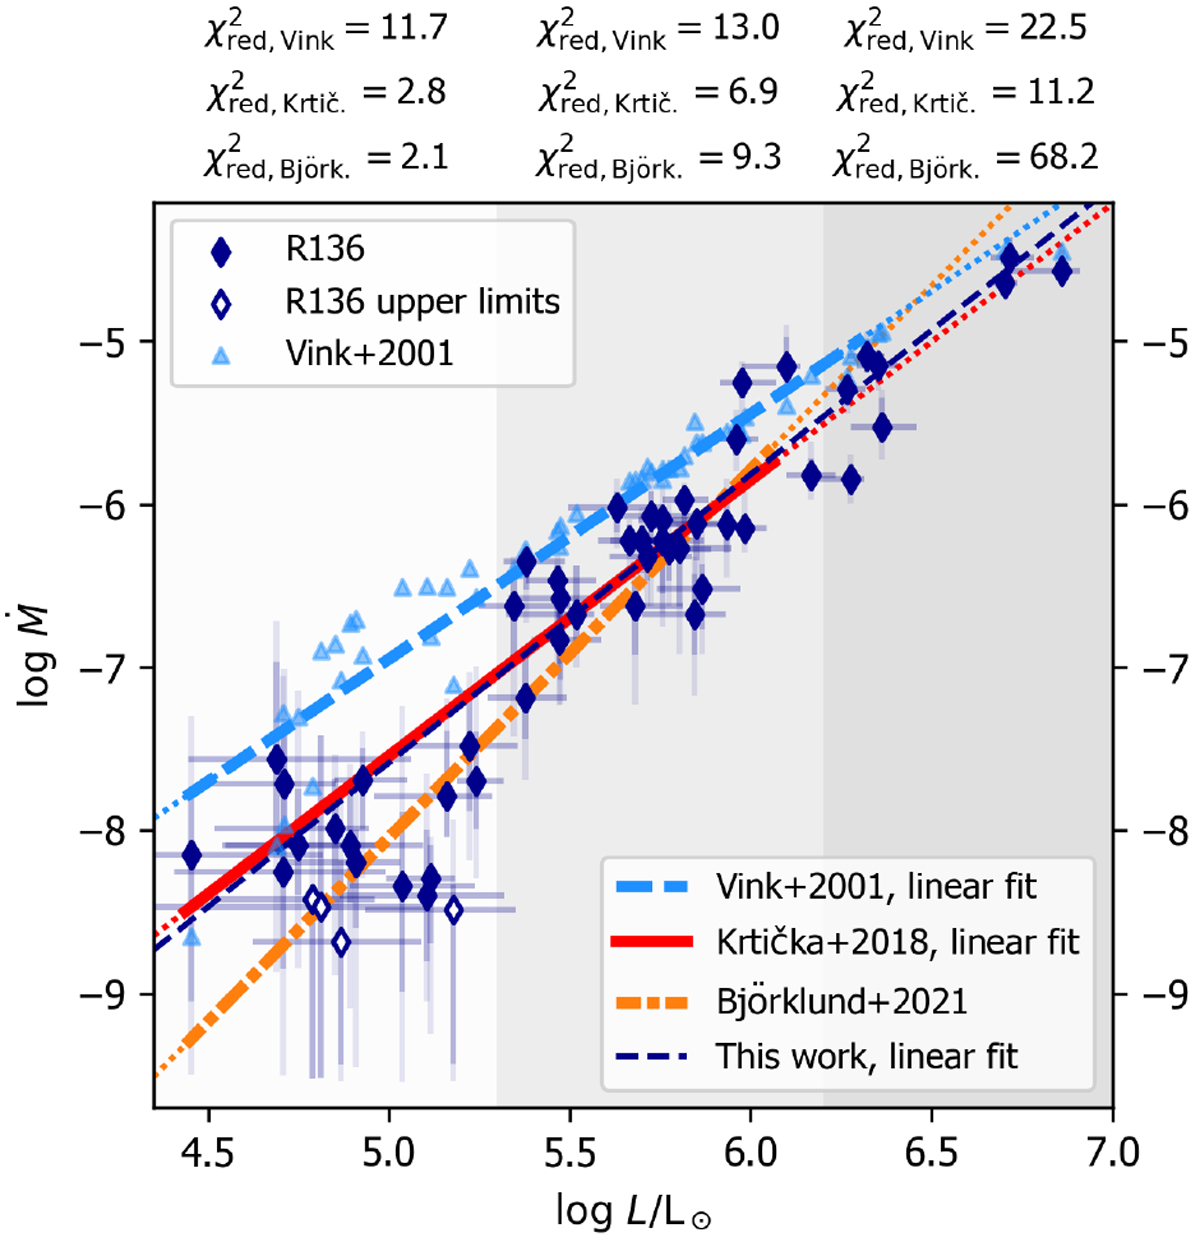
Mass-loss rates from the optical + UV fits (dark blue solid diamonds) compared to the mass-loss predictions of Vink et al. (2001, light blue triangles), Krtička & Kubát (2018, red solid line) and Björklund et al. (2021, orange dot-dashed line). The prescription of Vink et al. (2001) depends on more parameters than luminosity; a linear fit through the individual points (light blue dashed line) is plotted to guide the eye. Thin dotted lines in corresponding colours show the extrapolation of each prescription beyond the coverage of their respective model grids. For reference, a linear fit through the data points is shown (thin dashed darkblue line). For all mass-loss prescriptions we assess the goodness of fit (χ2-values, top) for three ranges of luminosity.
Current usage metrics show cumulative count of Article Views (full-text article views including HTML views, PDF and ePub downloads, according to the available data) and Abstracts Views on Vision4Press platform.
Data correspond to usage on the plateform after 2015. The current usage metrics is available 48-96 hours after online publication and is updated daily on week days.
Initial download of the metrics may take a while.